Key messages
- ADIs are well-capitalised to navigate through potential economic challenges on the horizon. Larger ADIs are expected to continue to raise Tier 2 capital ahead of APRA’s loss absorbing capacity (LAC) requirements coming into effect in January 2026.
- ADIs maintained high liquidity levels and are well positioned for the final repayments of the Term Funding Facility (TFF) in the June 2024 quarter.
- Asset quality remained sound. Rising asset prices, particularly in the housing sector, are helping to mitigate potential credit losses for borrowers and ADIs.
- ADIs’ profits remained stable over the quarter despite continued competition and narrowing margins.
Capital
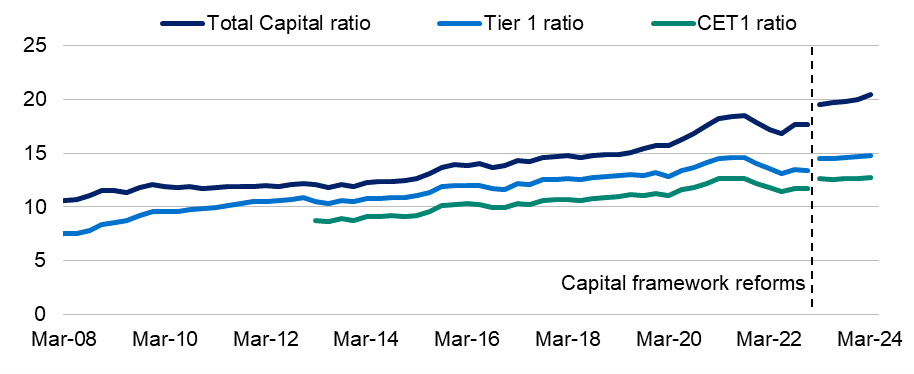
ADIs are well capitalised, with capital ratios continuing to increase over the quarter.
- The industry’s Total Capital ratio increased by 52 basis points over the quarter to 20.5 per cent.
- The Common Equity Tier 1 (CET1) ratio and Tier 1 ratios were 12.7 per cent and 14.7 per cent respectively. ADIs may continue to return capital to shareholders which would reduce CET1 from elevated levels.
Capital base as a percentage of total risk-weighted assets
Larger ADIs issued Tier 2 capital instruments, driving up the Total Capital ratio.
Quarterly change in total by component ($ billions)
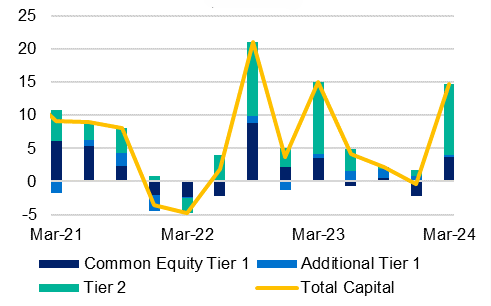
- Domestic systemically important banks (D-SIBs) are required to increase their capital levels to comply with APRA’s loss absorbing capacity (LAC) requirements, which comes into effect from 1 January 20261. This increases the minimum Total Capital requirement for these ADIs by 4.5 percentage points of risk-weighted assets (RWAs).
The increase in total capital in the March 2024 quarter was driven by the issuance of $11.2 billion of Tier 2 capital instruments by D-SIBs. These ADIs are likely to continue to issue these instruments in the lead up to 1 January 2026.
Year on year change on retained earnings (%)
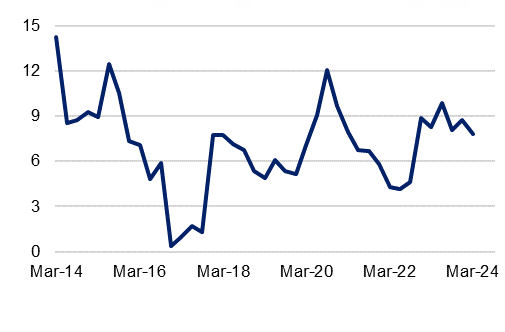
- Retained earnings fell marginally over the March quarter but have increased 7.8 per cent on an annual basis. Weakening profits may see future declines in retained earnings.
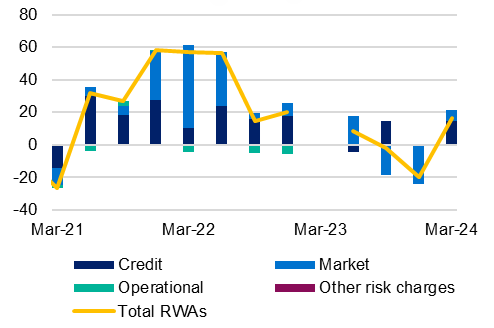
Risk-weighted assets were broadly stable.
Total RWAs by component ($ trillions)
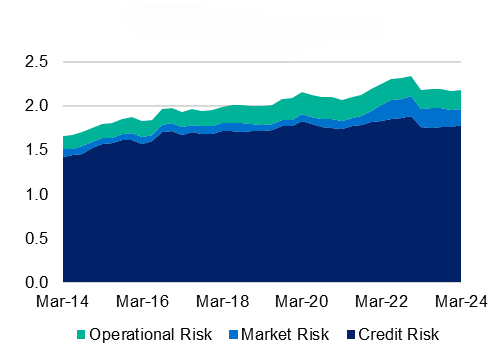
- Total RWAs increased marginally over the quarter by 0.8 per cent, driven by credit and market risk. The increase in credit RWAs is broadly aligned with credit growth.
- There continued to be some volatility in market RWAs predominantly due to interest rate risk in the banking book (IRRBB) RWAs. However, this volatility eased in the March quarter following movements in the yield curve that led to a reduction in banks’ embedded losses.
Quarterly change in total RWAs by component ($ billions)
Liquidity
ADIs reported strong liquidity positions and are well placed for the final repayments relating to the TFF.
High quality liquid assets as a percentage of net cash outflows, (LCR(%)
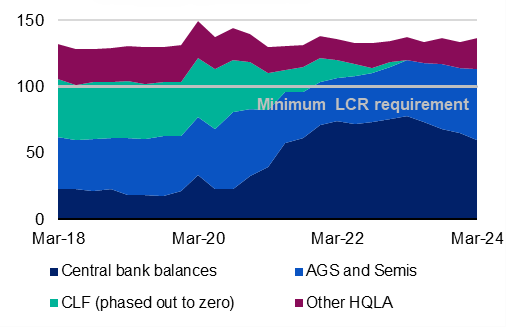
- Repayments of the TFF increased over the quarter, ahead of final maturities in June this year. As a result, ADIs’ holdings of high-quality liquid assets (HQLAs) decreased by 2.3 per cent over the quarter.
- The industry liquidity coverage ratio (LCR) increased 2.8 percentage points to 136.5 per cent, well above the regulatory minimum.
The industry’s funding base was stable
Net stable funding ratio (%)
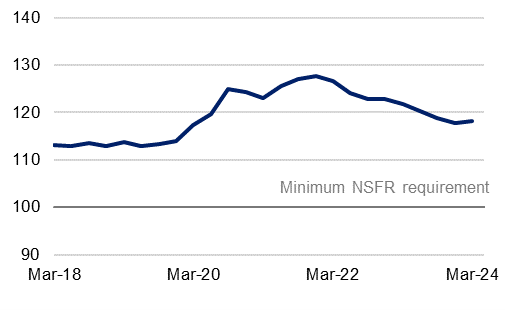
- The industry’s aggregate net stable funding ratio (NSFR) rose 41 basis points over the quarter to 118.2 per cent after a period of decline, and well above minimums. The NSFR had been declining due to the unwinding of pandemic measures and is expected to stabilise as this completes.
Smaller ADIs’ liquidity positions remained well above the regulatory minimum requirement.
MLH as a percentage of liabilities (%)
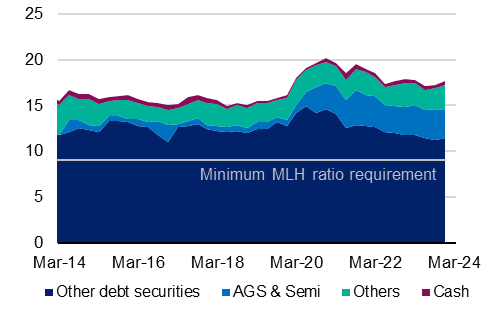
- Smaller and less complex ADIs, to which the minimum liquidity holding (MLH) ratio applies, reported an MLH ratio of 17.8 per cent. This was broadly unchanged from the previous quarter and well above the regulatory minimum of 9 per cent.
Asset quality
Non-performing loans continued to increase but overall asset quality remained sound.
Non-performing loans as a percentage of gross loans and advances (%)
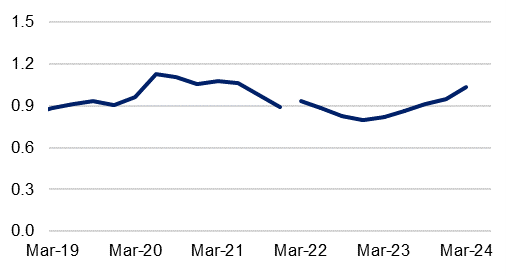
- High interest rates and prolonged inflation has continued to place pressure on borrowers. While most are continuing to adapt, there is a small but growing pocket of stressed borrowers.
- The ratio of non-performing loans remained low, reflecting sound asset quality. The ratio of non-performing loans rose 9 basis points to 1.0 per cent over March 2024. While this represents 12 months of continuous increase in the non-performing loan ratio, the rate of increase has been gradual.
- The increase in non-performing loans has been consistent across both retail and non-retail credit.2
Potential credit losses from loan defaults are mitigated by rising asset prices.
Share of non-performing loans that are well-secured (%)
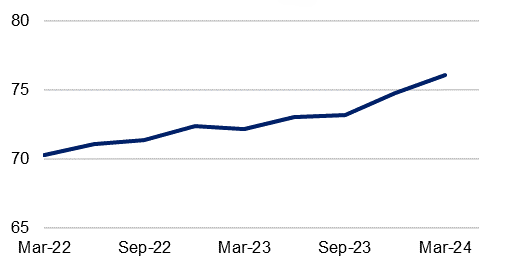
- Alongside the low but increasing trend in non-performing loans, the industry’s credit losses have stayed stable and at very low levels.
- This is, in part, reflecting the security profile of ADIs’ loan portfolios. Over three quarters of the value of loans entering non-performing status are well-secured. A well-secured loan is a loan where the value of its collateral is sufficient to cover the outstanding loan amount.
- The security profile of these portfolios has strengthened over time, with the share of non-performing loans that are well secured increasing from 70.3 per cent in March 2022 to 76.1 per cent in March 2024. This has been driven by increasing asset prices, particularly in the housing market.
- The industry’s provisioning coverage was stable. When viewed in combination with current capital levels, the industry is resilient and well-positioned to manage any future credit losses.
Financial performance
Industry profits and return on equity were stable from the previous quarter…
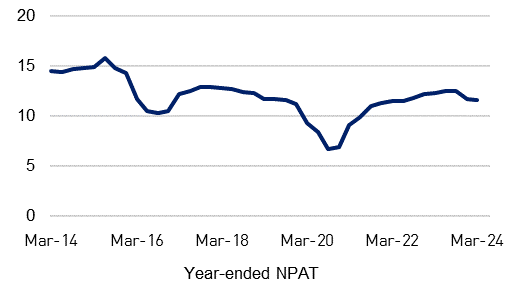
Net profit after tax ($billions)
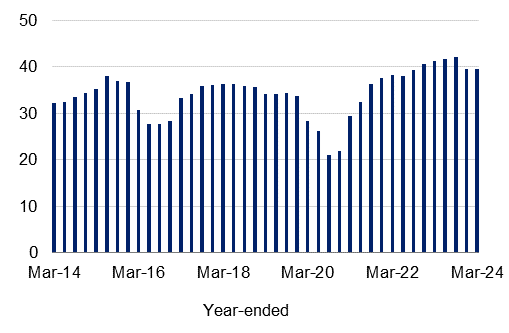
- Despite continued competition, ADIs’ profits were unchanged over the quarter. Net profit after tax (NPAT) was $39.4 billion for the year to March 2024.
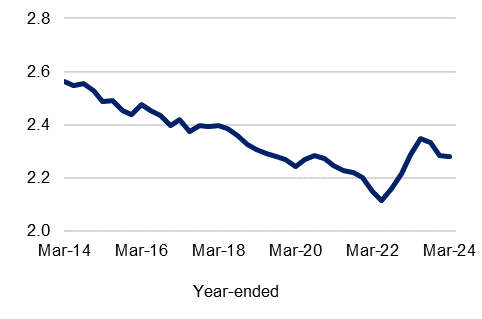
- Competition for loans and deposits continued to place pressure on ADIs’ margins. Net interest income as a percentage of gross loans and advances was stable at 2.3 per cent.
- The impact of competition on interest margins and subsequent pressure on profits has been partially offset by continued credit growth. Any prolonged moderation in credit growth could upset this balance.
- Return on equity (ROE) remained broadly in line with levels seen over the past decade. ROE declined marginally by 10 basis points to 11.55 per cent over the quarter. The decline was driven by an increase in total equity outstanding due to growth in retained earnings over the year.
Net interest income as a percentage of average gross loans and advances (%)
Return on equity (%)
…as ADIs continued to face challenges in managing expense growth.
Cost-to-income ratio (%)
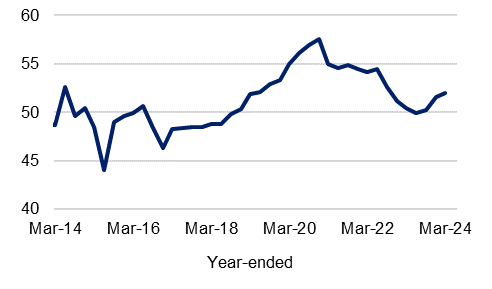
- The industry’s cost-to-income ratio increased, marking the third consecutive quarter of deterioration. ADIs personnel expenses continued to grow, rising 8.5 per cent over the year and remaining well above long term averages. This is significantly higher rate than the Wage Price Index growth of 3.6 per cent over the same period for the “Financial and insurance services” category.
- Slowing growth in operating income is likely to place increased pressure on ADIs’ expense management. Some ADIs have continued to announce redundancies over the March quarter.
Year-on-year change in personnel expenses (%)

Financial position
Credit growth has moderated to around the pre-pandemic average.
Year-on-year change in gross loans and advances (%)
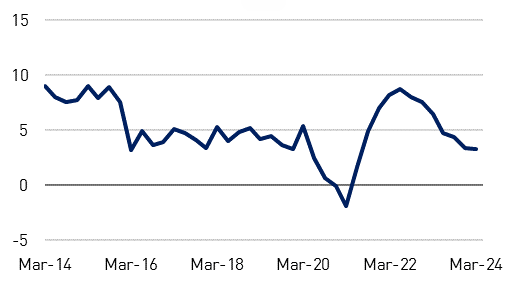
- Gross loans and advances grew 3.3 per cent on a year-on-year basis. In housing, growth in credit outstanding for owner-occupiers outpaced that of investors .3
Cash and liquid assets declined following repayments of the Term Funding Facility.
Year-on-year change in total assets components (%)
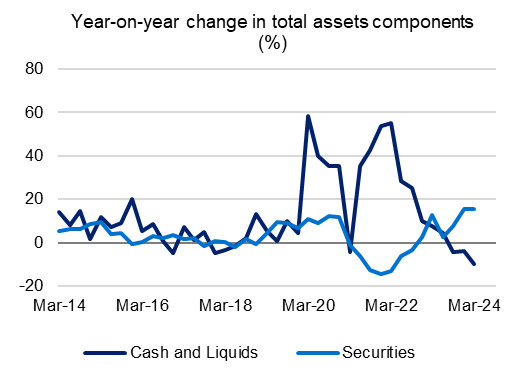
- Both total assets and total liabilities grew by 1.9 per cent on a year-on-year basis. Although this is well below post-pandemic highs, it is still in line with prior growth trends.
- ADIs’ cash and liquid asset holdings fell 9.7 per cent year-on-year.
Deposit growth was higher for at-call deposits than in fixed-terms.
Year-on-year change in deposit components (%)
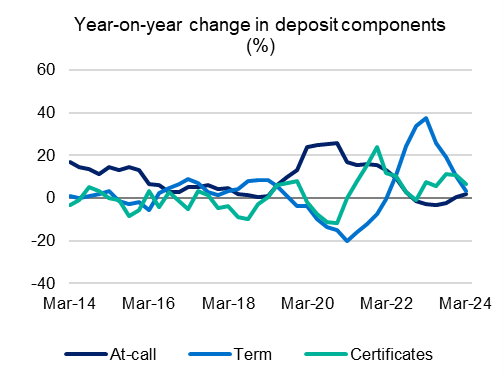
- Evolving expectations for interest rates has in part driven a change in depositor behaviour. Growth in holdings of term deposits have moderated, while at-call deposits have returned to positive growth.
Population changes
The number of ADIs on a consolidated group basis operating in Australia declined from 140 to 138 over the quarter:
- First Choice Credit Union Ltd. had its licence revoked, ceasing to be an APRA regulated ADI as at 26 February 2024.
- Islamic Bank Australia Pty. Ltd. has its licence revoked, ceasing to be an APRA regulated ADI as at 1 March 2024.
Additionally, APRA made the following ADI licence amendments during the quarter:
- Avenue Bank Ltd. was granted a licence to operate as an unrestricted ADI effective 21 February 2024, having previously been granted a restricted ADI licence effective 7 September 2021.
Footnotes
1 Finalising loss-absorbing capacity requirements for domestically systematically important banks.
2 A more detailed breakdown on a subset of these exposures can be found in the accompanying Quarterly ADI Property Exposures (QPEX) Highlights.
3 Further details on credit outstanding can be found in the accompanying Quarterly Property Exposures (QPEX) highlights.