Update on APRA’s Macroprudential Policy Settings
Executive summary
This Information Paper provides an update on APRA’s macroprudential policy settings. It sets out what the current settings are and explains the key factors that have informed APRA’s decision-making, enhancing transparency on macroprudential policy.
Macroprudential policy
The objective of macroprudential policy is to mitigate risks to financial stability at a system-wide level.1 APRA published a new framework for macroprudential policy in 2021, which detailed the objectives, toolkit and implementation process.2
APRA makes decisions on macroprudential policy after careful consideration and consultation with other agencies on the Council of Financial Regulators (CFR), to ensure there is alignment, challenge and coordination across regulators.
Current policy settings
As set out in the framework, APRA’s core macroprudential policy toolkit is focused on capital and credit measures. The current operative settings, in effect from 1 January 2023, are a 1.0 per cent neutral level for the countercyclical capital buffer (CCyB) and a 3.0 per cent loan serviceability buffer.
Macroprudential tool | Current settings | Summary |
Capital-based | ||
Countercyclical capital buffer (CCyB) | 1.0 per cent of RWA | The CCyB is currently held at a neutral level of 1.0 per cent, providing a buffer for stress |
Capital distribution constraints | None in place | There are no system-wide restrictions in place on capital distributions, such as dividends |
Credit-based | ||
Serviceability buffer | 3.0 per cent above loan rate | The serviceability buffer is maintained at 3.0 per cent, a key part of prudent lending standards |
Lending limits | None in place | There are no APRA limits in place on higher-risk lending at a system-wide level |
Assessment
APRA’s assessment is that existing macroprudential policy settings remain appropriate in the current risk environment.
APRA instituted a neutral rate of 1.0 per cent of risk weighted assets (RWA) for the CCyB, as part of the recent reforms to the bank capital standards.3 The CCyB is a buffer that can be relaxed if needed by APRA in a downturn, to provide banks with flexibility to absorb rather than amplify the impact of systemic shocks. Key indicators of stress suggest that economic conditions are not at a point where this would be required, and credit growth remains positive.
APRA has also maintained the serviceability buffer at 3.0 per cent above the loan rate. This buffer was increased to this level in late 2021, in an environment of heightened risks for the financial system. While lending at high debt-to-income ratios has reduced, a key concern at the time, heightened risks to serviceability remain: there is the potential for further interest rate rises, high inflation and risks in the labour market. It is important that all banks maintain prudent lending in the current environment of competitive pressure on standards.
Outlook
Looking ahead, there is a high degree of uncertainty in the outlook. On the one hand, there are signs of a deterioration in conditions, including falling asset prices and the potential for pockets of stress. On the other hand, lending standards are broadly sound, loan arrears remain low and the banking system is well capitalised.
APRA, together with other members of the CFR, will continue to monitor key risk indicators. In particular, APRA is closely monitoring credit growth, asset prices, lending conditions and financial resilience. Should risks to financial stability change, APRA will adjust its macroprudential policy settings accordingly.
Footnotes
1 Macroprudential policy measures are counter-cyclical in nature; they seek to build additional resilience or reduce excessive risk-taking during an upswing in the financial cycle, and can provide flexibility for the financial sector in supporting the economy during a downturn.
2 See APRA, Macroprudential Policy Framework (Information Paper, November 2021). As part of this framework, APRA also required banks to pre-position for macroprudential policy measures through specific requirements in Prudential Standard APS 220: Credit Risk Management. These requirements ensure that macroprudential policy can be implemented in a timely, consistent and enforceable manner.
3 The CCyB is a requirement in Prudential Standard APS 110 Capital Adequacy (APS 110). For an overview of the bank capital reforms, see Information Paper – An Unquestionably Strong Framework for Bank Capital, November 2021.
Chapter 1 - Macroprudential settings
This chapter sets out current settings for APRA’s core macroprudential measures, explaining the key considerations and trade-offs that have informed decision-making.
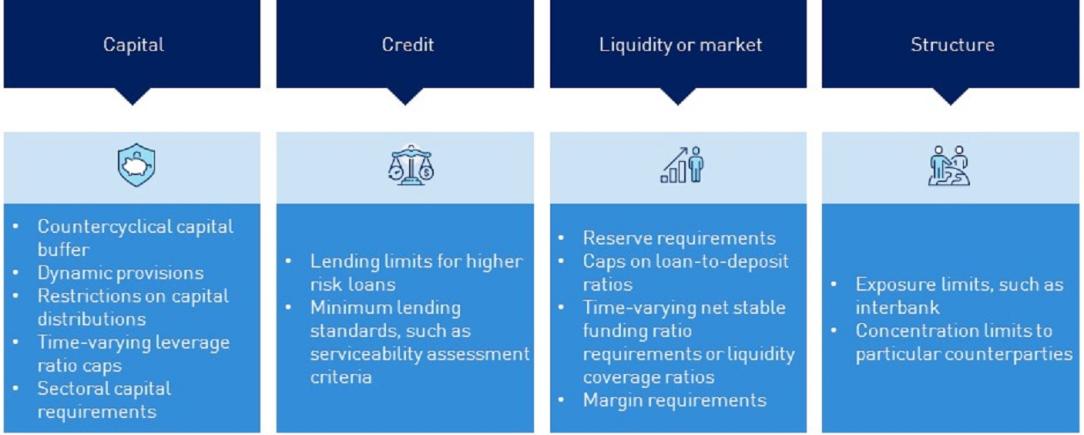
As outlined in the snapshot below, there are a wide range of potential tools that have been used internationally. Given the risks more prevalent in Australia, APRA’s focus to date has primarily been on capital and credit measures.
Capital measures
As set out in APRA’s macroprudential policy framework, capital measures can strengthen the financial system’s resilience as systemic risks are building, and provide additional flexibility to support economic activity in a downturn.
Macroprudential tool | Current settings | Instrument |
Countercyclical capital buffer (CCyB) | 1.0 per cent of RWA | Prudential Standard APS 110 Capital Adequacy (APS 110) |
Capital distribution constraints | None in place | Prudential Standard APS 110 Capital Adequacy (APS 110) |
The key capital measure is the CCyB. There are currently no APRA system-wide constraints on capital distributions. From 1 January 2023, the CCyB has been set a neutral level of 1.0 per cent of risk-weighted assets (RWA). In setting this neutral level for the CCyB, APRA has built greater flexibility into bank capital buffers.4
Based on the current outlook, APRA considers the neutral 1.0 per cent setting for the CCyB to be appropriate. The banking sector is well capitalised with an aggregate common equity tier 1 capital ratio of 11.7 per cent, as at September 2022. APRA’s latest stress testing indicates that this would provide sufficient capacity for banks to absorb significant economic stress and maintain the supply of credit.
If there was a marked deterioration in economic conditions or the financial strength of the system, APRA may consider releasing the CCyB to provide flexibility to banks to ensure they continue to lend to support households and businesses. While an increase in non-performing loans is expected in the period ahead, most early warning indicators for stress in banks’ loan books remain contained.
Credit measures
There are two key complementary sets of credit measures: lending standards set by banks for individual loans at origination, and lending limits that operate at a portfolio level. Credit measures can also be applied to non-ADI lenders, should circumstances warrant it.
Macroprudential tool | Current settings | Instrument |
Serviceability buffer | 3.0 per cent above loan rate | Prudential Standard APS 220: Credit Risk Management (APS 220) |
Lending limits | None in place | Prudential Standard APS 220: Credit Risk Management (APS 220) |
Serviceability buffer
The objective of the serviceability buffer is to ensure that banks make prudent lending decisions, lending to borrowers that are able to repay their loans in a range of scenarios. The buffer provides an important contingency not only for rises in interest rates over the life of the loan, but also for any unforeseen changes in a borrower’s income or expenses.
In October 2021, APRA raised the minimum serviceability buffer from 2.5 to 3.0 percentage points above the loan product rate.5 In an environment of high household debt and increasing levels of higher risk lending to borrowers at high debt-to-income ratios, this was an important risk mitigant. The increase in the serviceability buffer, in conjunction with active supervision of bank risk appetite, has helped to reduce higher risk lending.
APRA’s view is that the current level of serviceability buffer remains appropriate in the current environment. There remain heightened risks to serviceability, including the potential for further increases in interest rates, continued high inflation and risks in the labour market. It is important that banks’ lending remains prudent at this point in the cycle.
However, it is also important that good borrowers can get access to credit, and that standards are not excessively conservative. APRA will therefore closely monitor credit growth, including for key segments of the housing market, as well as a range of other key indicators such as bank risk appetites, the quality of new lending and the level of buffer applied in practice by banks. If the balance of risks change, APRA will adjust its settings accordingly.
Lending limits
The purpose of macroprudential lending limits would be to restrain certain types of higher risk lending temporarily, where these are contributing to risks to financial stability. These measures are typically a targeted response to specific risks, and would serve to improve the risk profile of bank balance sheets.
Under APRA’s prudential standards, APRA can apply lending limits on an industry-wide basis or for a cohort of ADIs, if there is an excessive concentration or growth in higher risk lending. There are currently no lending limits applied by APRA, although supervisors continue to closely monitor higher risk lending at outlier banks, including recent strong growth in commercial property lending.6
Non-ADI lenders
APRA also has powers that can be used to extend macroprudential policy to non-APRA regulated lenders, in certain circumstances.7 Part IIB of the Banking Act 1959 allows APRA to extend macroprudential policy to non-ADI lenders where their provision of finance is materially contributing to risks of instability in the Australian financial system.
APRA’s assessment is that there is no need to apply macroprudential policy measures to non-ADI lenders. In December 2022, the CFR considered its annual review of non-bank financial intermediation8. While non-bank lending for housing has continued to grow strongly, recent trends would not suggest there is currently a risk to financial stability. The non-bank sector in Australia accounts for a relatively small share of system-wide lending in housing lending, at less than 5 per cent. CFR agencies are continuing to monitor developments in this sector.
Footnotes
4 See APRA Information Paper, 2021, APRA finalises new bank capital framework designed to strengthen financial system resilience. The CCyB is held in the form of Common Equity Tier 1 capital. APRA can increase the CCyB up to 3.5 per cent of RWAs, or drop it to zero if needed. By supporting the drawdown of capital buffers as economic conditions deteriorate, APRA can provide the financial system with greater flexibility to absorb, rather than amplify, the impact of systemic shocks.
5 Letter to ADIs: Strengthening residential mortgage lending assessments (6 October 2021). Over the past year, there has been a marked increase in lending rates. The impact on particular borrowers will vary, depending on their financial position and repayment buffers. The majority of households typically borrow less than their maximum capacity, providing an additional margin for changes in serviceability.
6 APRA introduced lending benchmarks in 2014 and 2017, to mitigate risks associated with strong growth in investor and interest-only housing loans. These benchmarks were subsequently removed as risks abated.
7 Non-ADI lenders provide loans to households and businesses. They are not required to hold an ADI licence unless they meet the criteria to be classified as an ADI (including, for example, specified deposit-taking activities).
Chapter 2 - Risk assessment
APRA monitors a range of key indicators to determine whether risks to financial stability are heightened, and in turn whether there is a need for adjustments to macroprudential policy settings. This chapter sets out a review of the key indicators that APRA has considered in assessing the risk environment.
Risk indicators
APRA monitors a range of quantitative and qualitative information to inform macroprudential policy, with a focus on four key indicators that have been shown empirically to highlight emerging systemic risks: credit growth and leverage; growth in asset prices; lending conditions; and financial resilience.
There is no mechanical link between any indicator and APRA’s decisions on macroprudential measures. In combination, however, these indicators help to inform APRA’s judgements on the outlook.
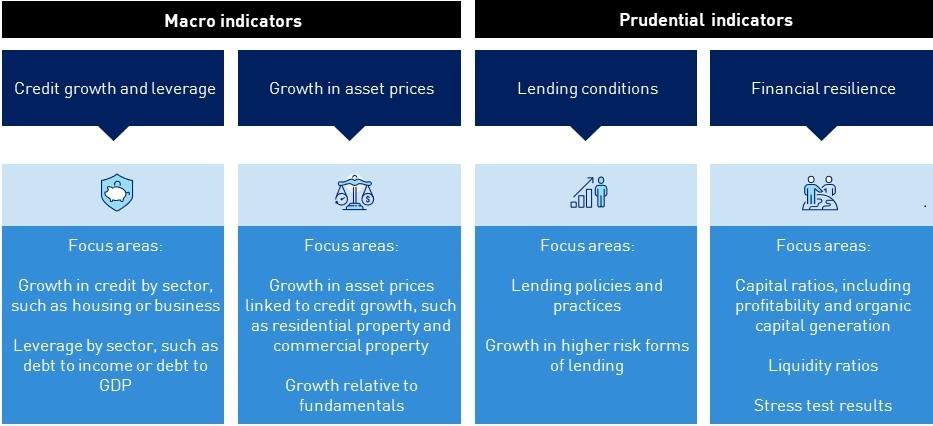
In summary, the current set of indicators present a mixed picture. While credit growth is slowing from recent peaks, it remains relatively strong. Asset prices have fallen, with declines in the housing market, but overall household debt to income remains high. Indicators of stress in banks’ loan books are low, lending standards sound and banks well capitalised.
Overall, there is no strong case to tighten or relax macroprudential policy measures. However, as the IMF has noted in their recent Article IV assessment of Australia, it will be important to continue to monitor risks due to “potential pockets of vulnerability stemming from the interaction of higher interest rates, high household debt, and falling housing prices.”9
Credit growth
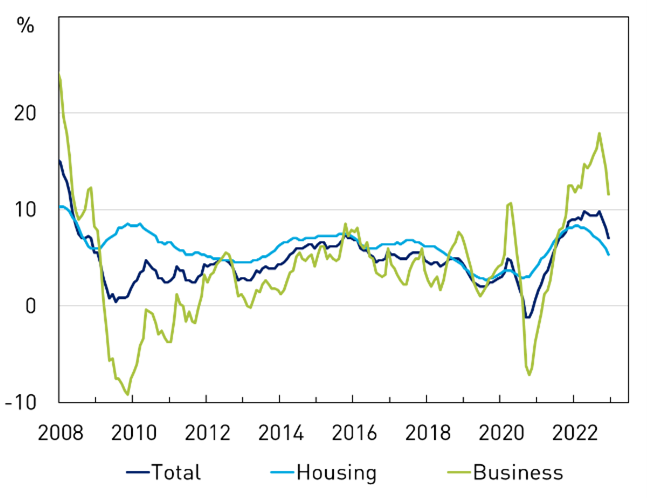
Credit growth remains strong, albeit slowing following a period of above-average growth. Total system credit growth was 8 per cent in the year to December 2022, above the post-GFC average of 5 per cent, but down from a high of 9 per cent in 2021. Leading indicators, such as the level of new loan approvals, suggest that credit growth may slow further.
The aggregate indebtedness of the household sector has risen over recent years. Australian household debt is high by both historical and international standards. A highly indebted household sector can be less resilient to future shocks, such as from rising interest rates, higher living expenses or a reduction in income. This requires ongoing prudence in lending standards.
| Credit Growth Six-month annualised rate | Household Debt to Income |
 Source: APRA; RBA. | 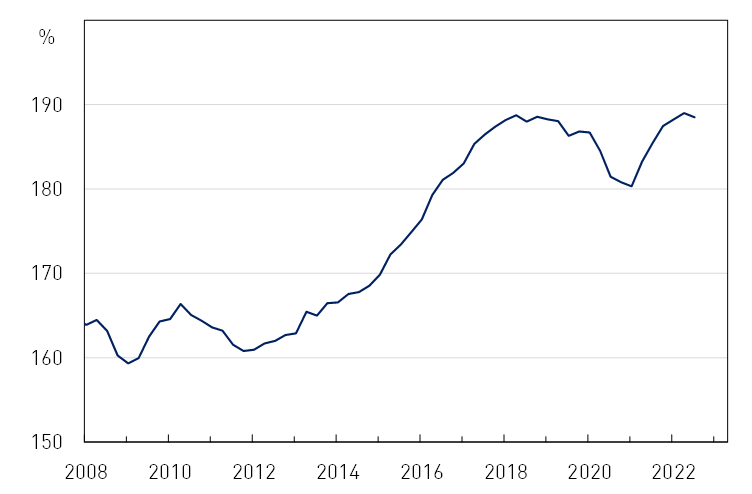 Source: ABS, APRA |
Business credit growth has been very strong in recent years, underpinned by demand from larger corporates. Business credit growth was 13 per cent in the year to December 2022, much higher than the post-GFC average. Some of this recent growth has been driven by lending for commercial property, a higher risk class of bank lending in Australia. APRA supervisors are engaging with banks that have reported very strong growth to ensure that lending is prudent and risk appetite appropriate.
Asset prices
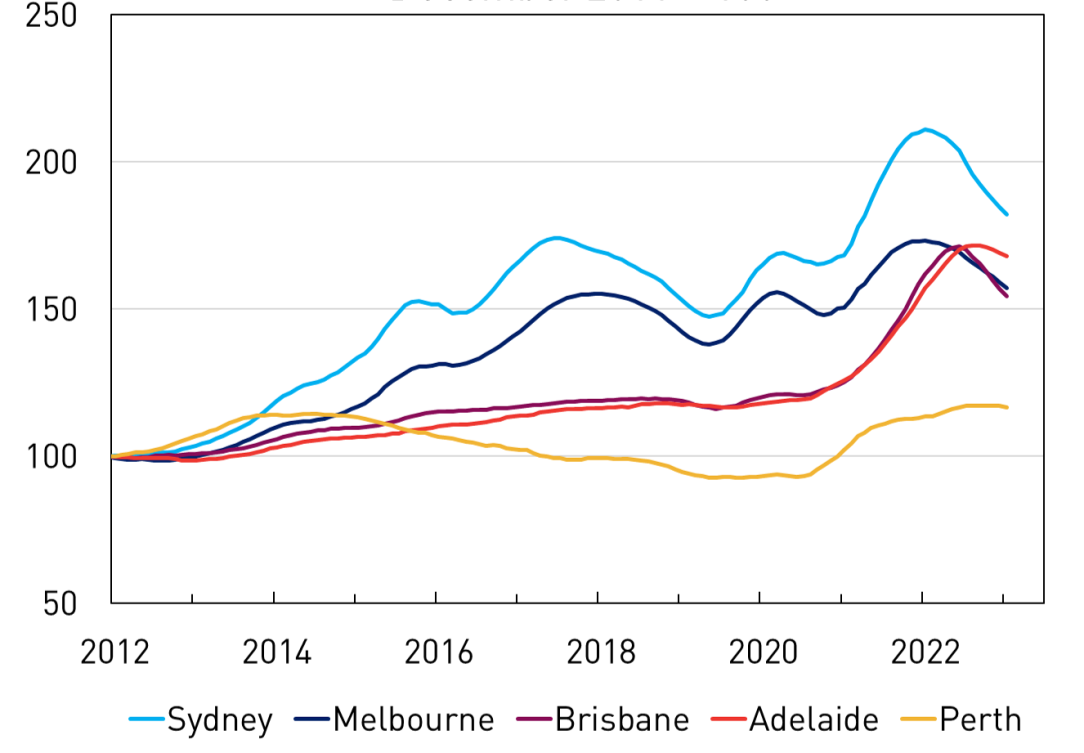
Housing prices have declined over the past 12 months, following several years of strong growth. Nationwide housing prices have declined by 8 per cent since their 2022 peak, but remain more than 18 per cent higher than at the end of 2019. Recent declines have been broad-based across the country, though the largest falls have typically been reported in more expensive geographic areas.
Housing Prices | Commercial Real Estate Valuations December quarter 2011 = 100 |
 Source: APRA; CoreLogic. | 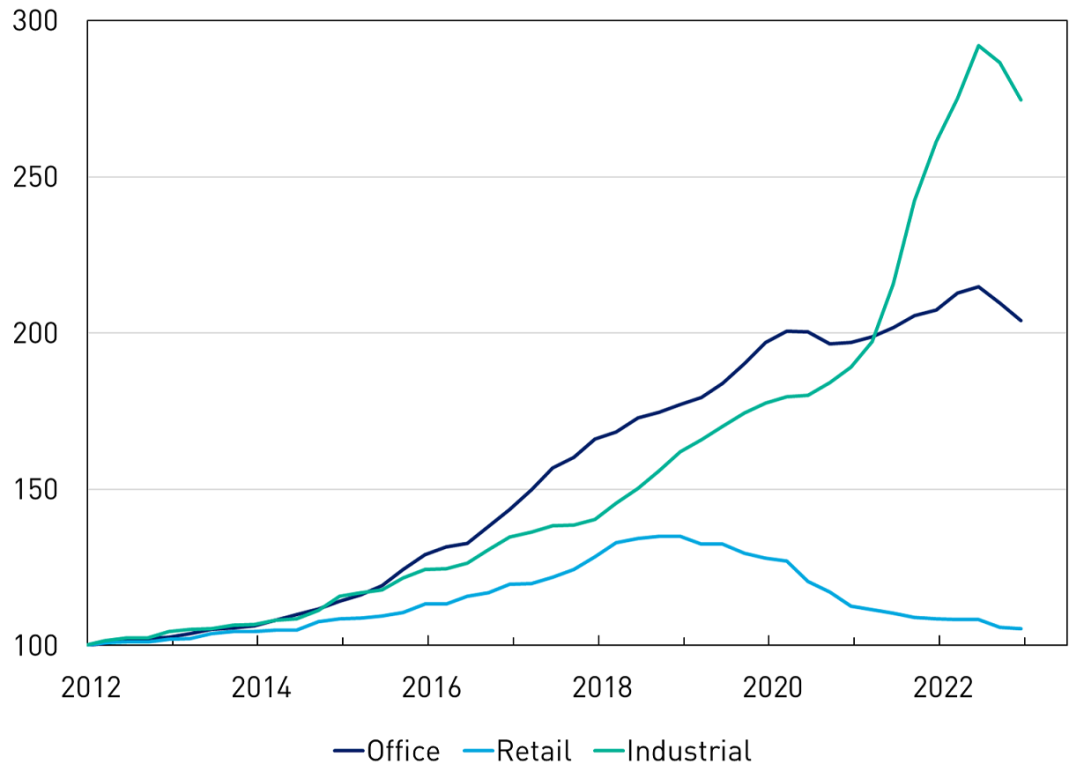 Source: APRA; JLL. |
Commercial property values have also declined since mid-2022. These falls have been most pronounced in the industrial sector, which recorded the sharpest increases over 2020 and 2021. The retail sector has also continued to face challenges in the post-pandemic environment.
Lending conditions
Key indicators of the quality of new lending have remained broadly at prudent levels. Housing loans with a loan-to-valuation ratio (LVR) above 90 per cent represented 6 per cent of new lending in the September 2022 quarter, declining from recent peaks and below average levels historically. The proportion of interest-only housing loans and the proportion of lending to investors have also remained well below their long-run historical average levels.
Lending at high debt-to-income (DTI) ratios has also declined over the past year. This decline has coincided with higher interest rates and targeted prudential measures, such as the higher serviceability buffer and heightened supervision of banks’ risk appetite settings. In the September quarter 2022, the share of lending at high DTIs (six or more) was 17 per cent, compared to 23 per cent a year earlier.
| High LVR Housing Lending Share of new lending | High Debt-to-income Housing Lending Share of new bank lending |
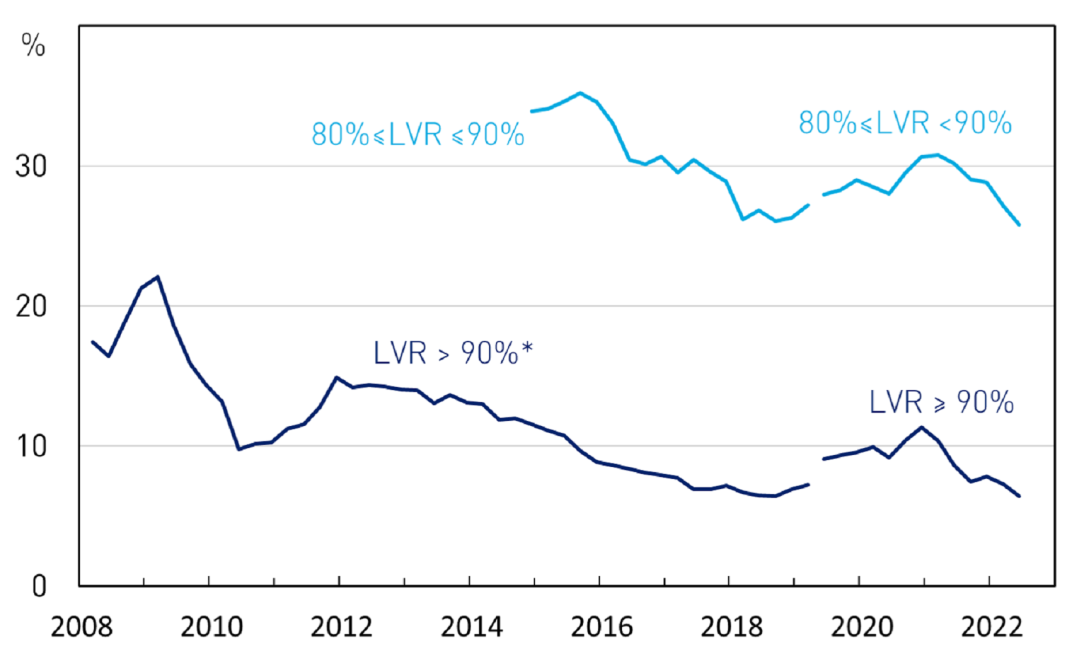 *LVR series break at June 2019 due to reporting changes. Date prior to this date is based on new loan approvals. Data from June 2019 onwards reflect new loans funded.
Source: APRA | 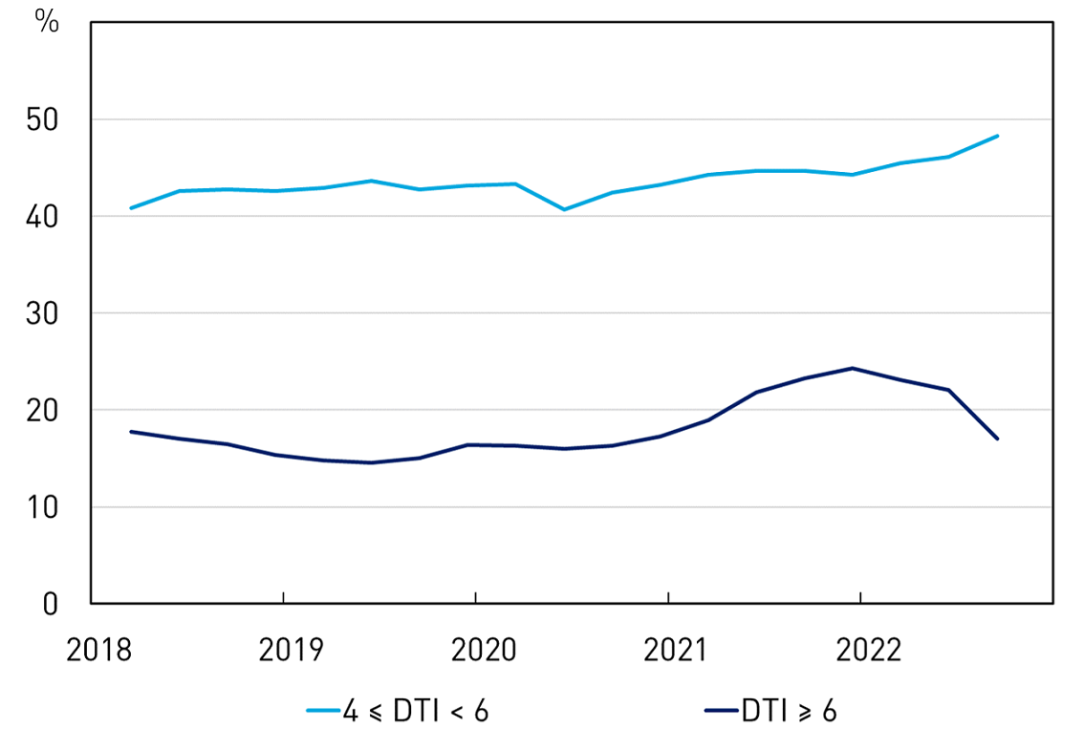 Source: APRA |
Financial resilience
Financial resilience remains strong. Australian banks are well capitalised and operate within the top quartile of international peers. APRA’s latest stress testing indicates that the banking sector could absorb a significant deterioration in asset quality while continuing to provide credit to households and businesses. In aggregate, banks’ common equity tier 1 capital ratio was 11.7 per cent at September 2022.
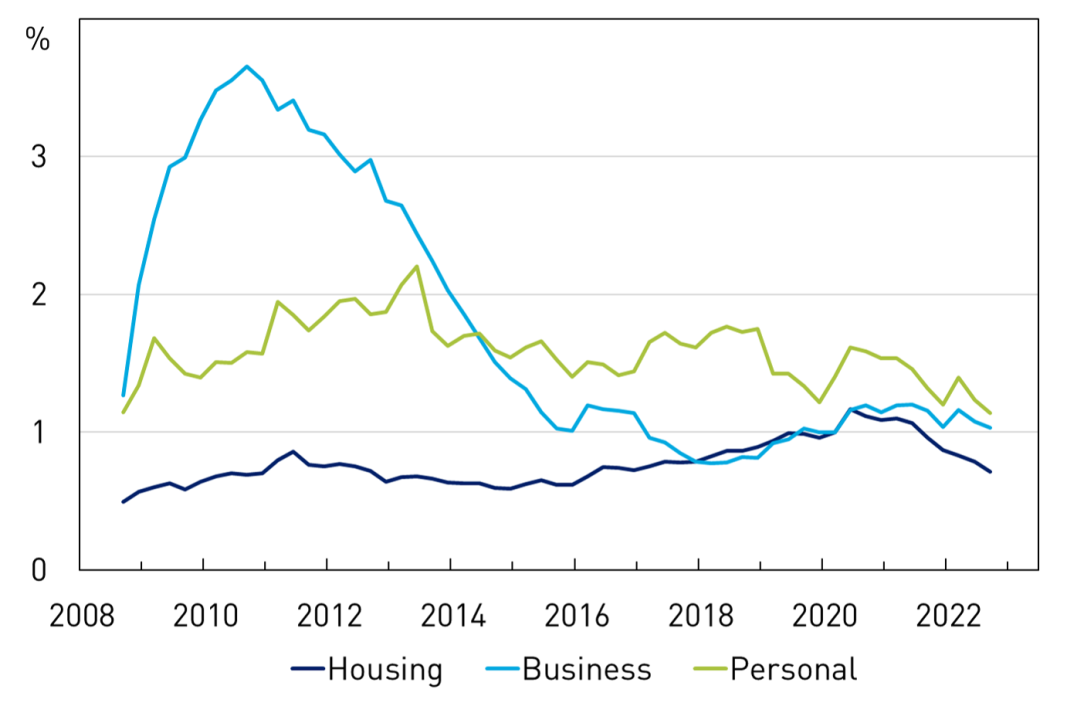
| Non-Performing Loans by Lending Type Domestic operations, share of lending | Aggregate Capital Ratios ADI Sector, share of risk-weighted assets |
 Source: APRA | 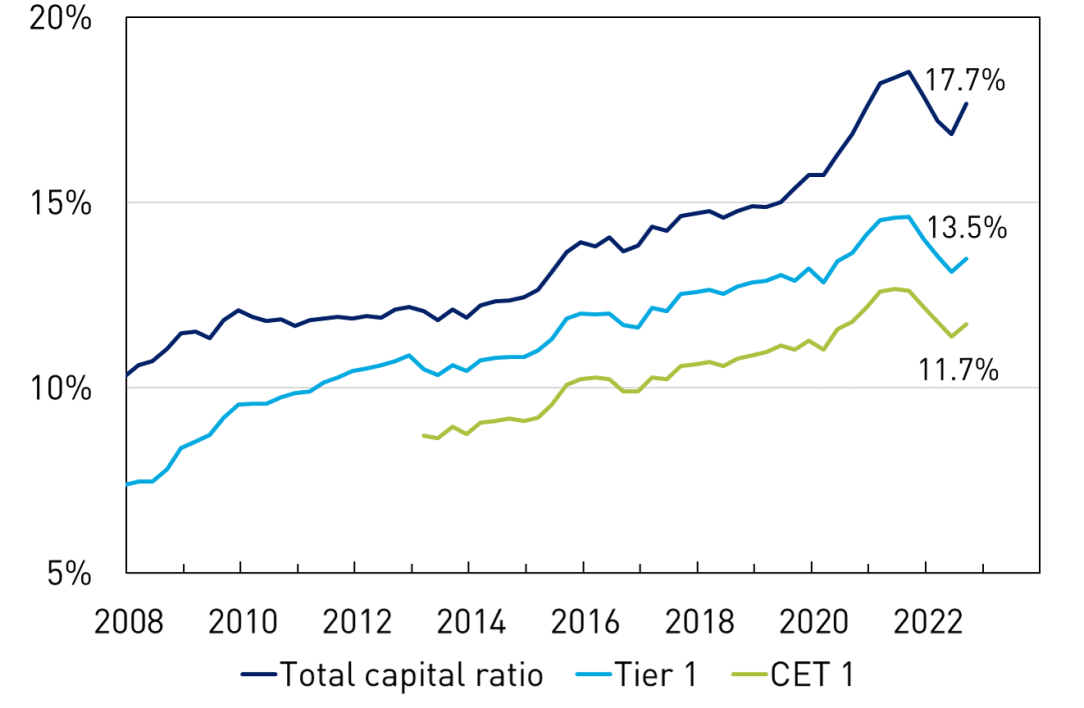 Source: APRA |
Signs of stress in banks’ loan portfolios remain low, with the level of non-performing loans less than 1 per cent of total credit exposures. While some deterioration is expected, most recent early warning indicators, such as the share of loans that are 30 days past due, have not yet shown signs of systemic stress.
A key area of focus for supervisors is the performance of banks’ fixed rate housing loans. At the end of 2022 around a third of outstanding housing credit was on fixed-rate terms, and these borrowers will face an adjustment to higher interest rates. Around half of these borrowers on fixed rate terms will transition off their current arrangements by the end of 2023. APRA supervisors are engaging with banks to ensure that they are proactively managing this risk.
Footnotes
9 IMF, Article IV assessment of Australia, February 2023.
