Update on APRA's Macroprudential settings - November 2024
Overview
APRA has confirmed it will maintain its existing macroprudential policy settings.
- The mortgage serviceability buffer will remain at 3 percentage points.
- The countercyclical capital buffer (CCyB) will remain at 1 per cent of risk-weighted assets.
- No limits on lending or constraints on capital distributions are being introduced at this juncture.
Uncertainty in the economic outlook remains and the risk of financial shocks has not abated, although the sources of this uncertainty have shifted over the past year or so. Risks from higher interest rates and inflation have receded somewhat, though underlying inflation remains elevated. Cost-of-living pressures continue to weigh on households and the risk of shocks to incomes from a slowing labour market are prominent. Meanwhile, risks in the global economic environment which could impact the Australian financial system – including ongoing geopolitical instability – are pronounced. Credit is flowing to households and businesses and is accessible to good quality borrowers. That said, the level of household debt in Australia is high relative to incomes both compared with its long-term history and relative to international peers, making this a key vulnerability if adverse economic scenarios came to pass.
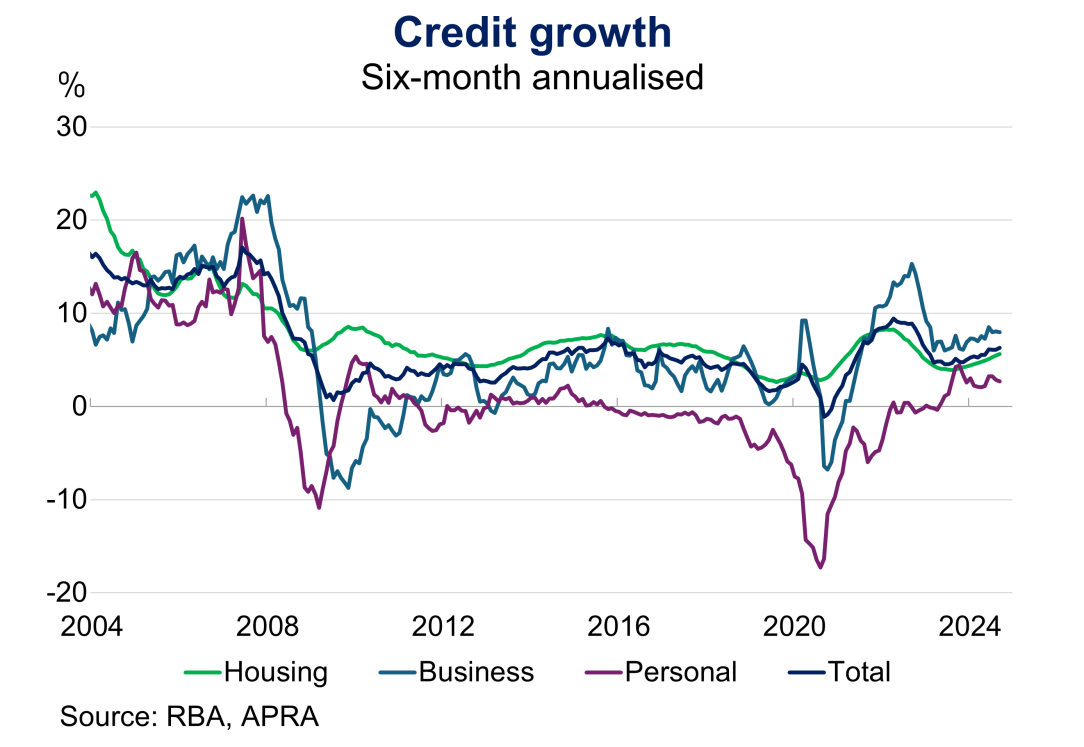
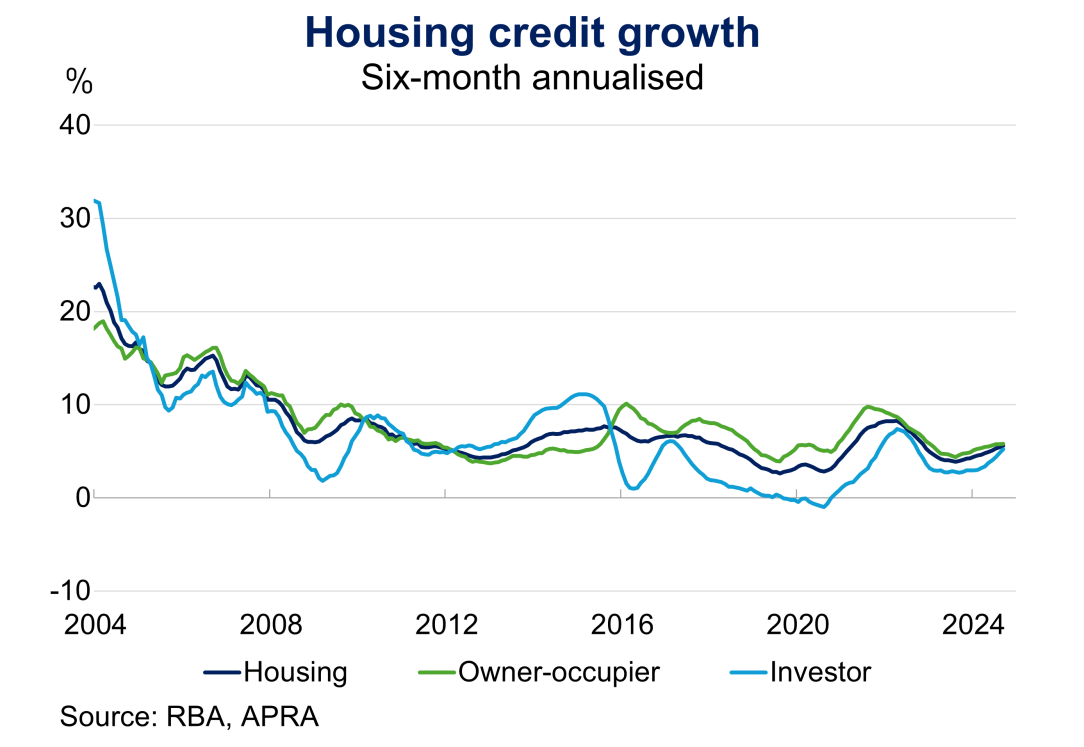
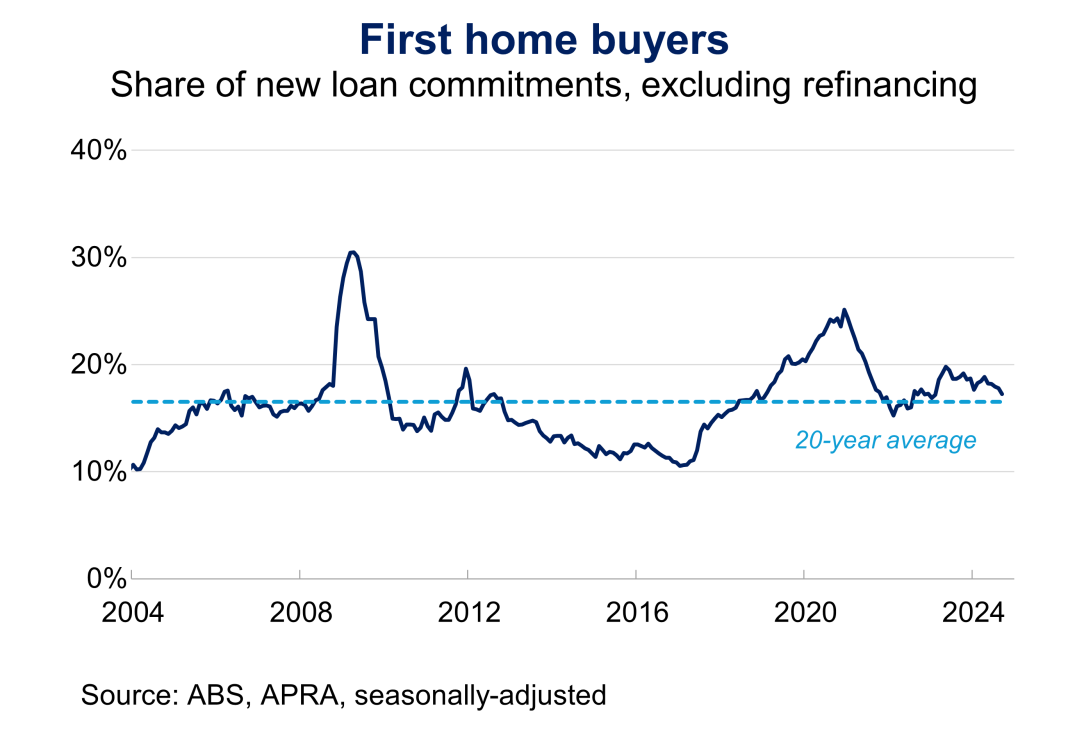
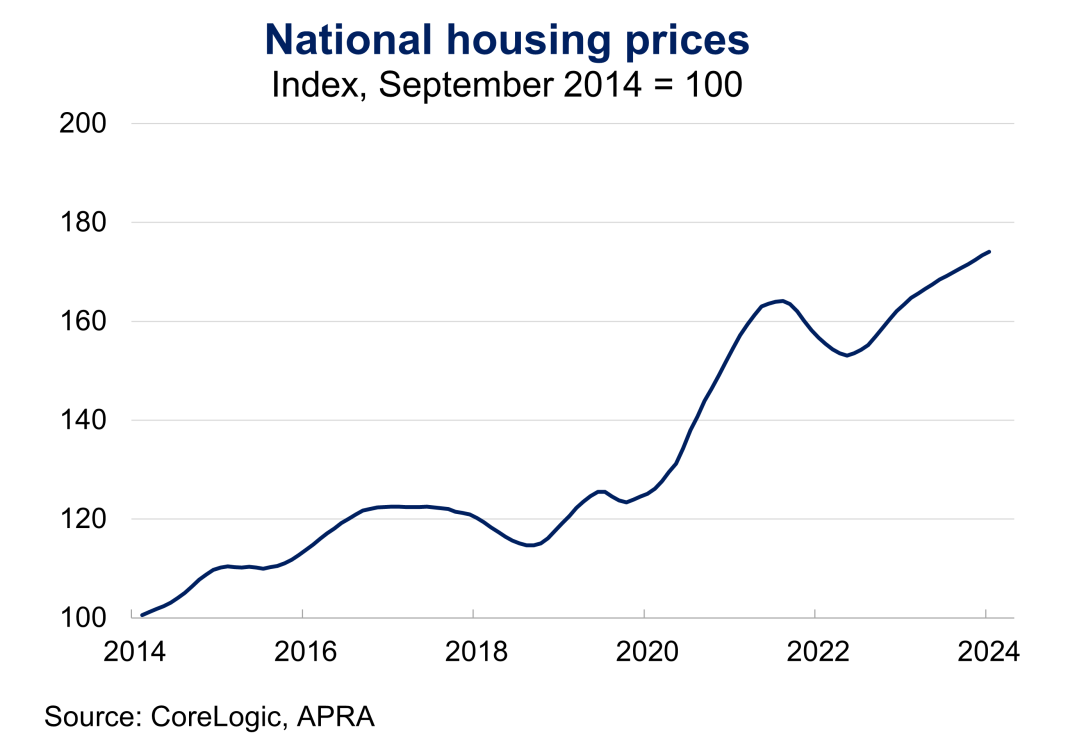
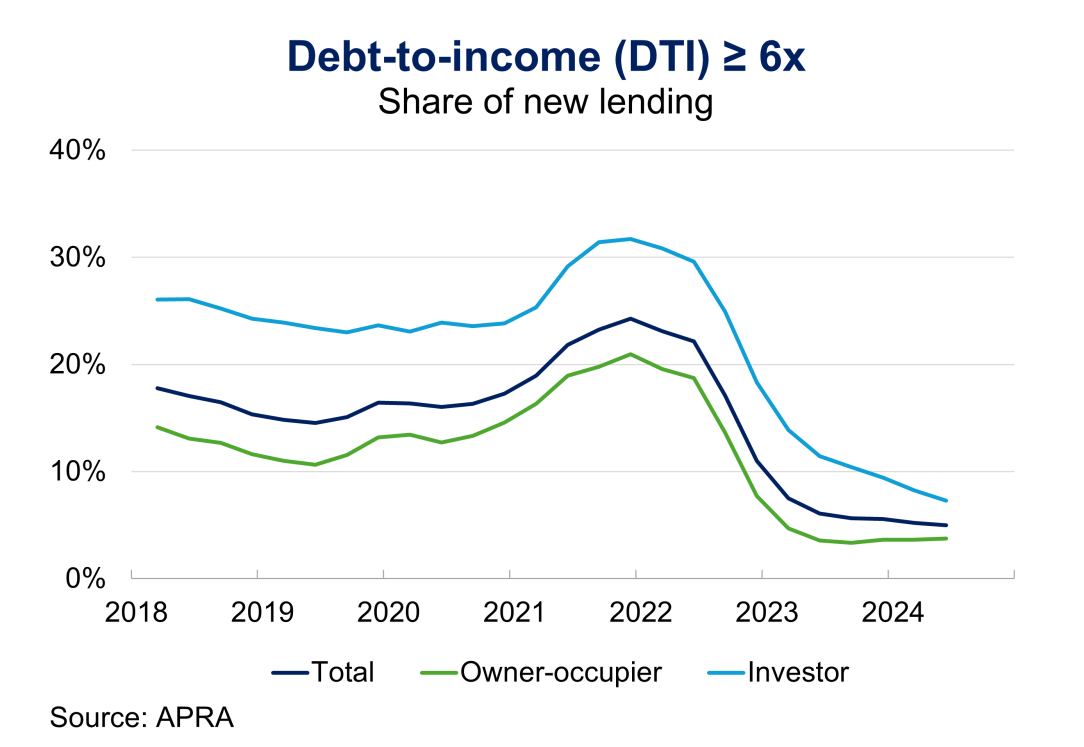
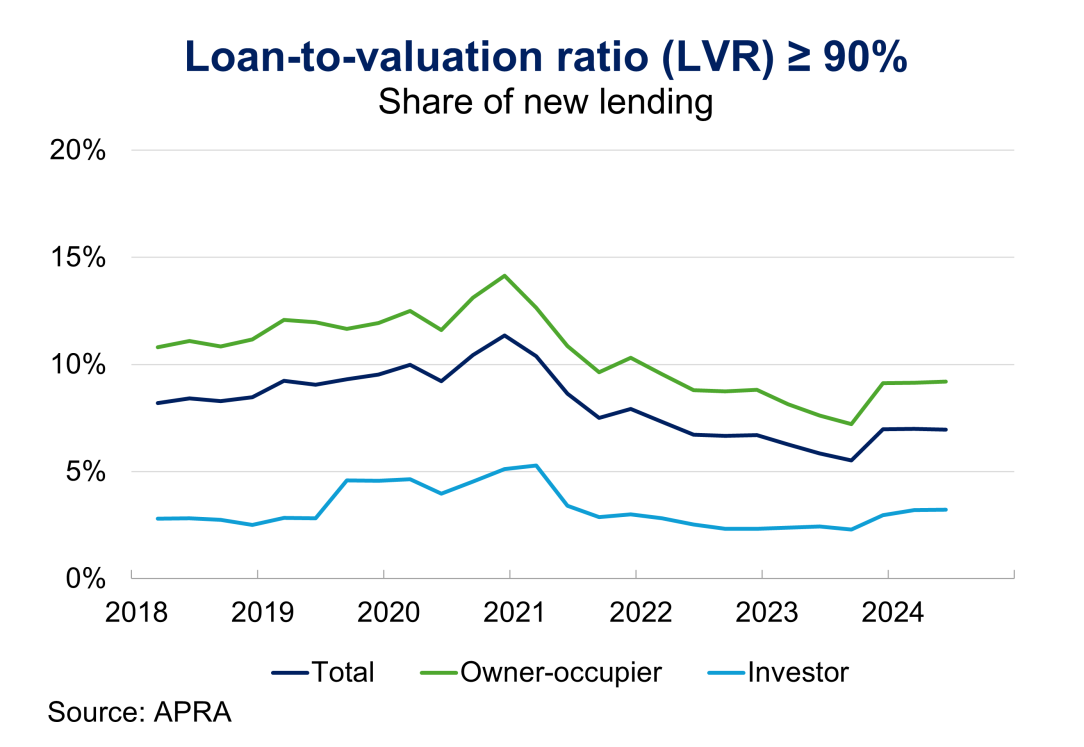
Housing price growth has eased in recent months to around long-term average rates (6 per cent per annum), but housing prices remain 40 per cent higher than before the pandemic. Despite restrictive monetary policy settings, housing and business credit growth have picked up over 2024 and total credit growth is around long-term average rates (Chart 1.1). In mortgage lending, credit has continued to flow across different borrower segments; the share of new lending that flows to first-home buyers (FHBs) is around its long-term average (Chart 1.4). The quality of new housing lending has remained sound, with higher-risk lending remaining at low levels (Charts 3.1 and 3.2). Business credit growth has also strengthened this year, supported by new lending to medium-sized businesses which has outpaced new lending to larger corporations and to small businesses.
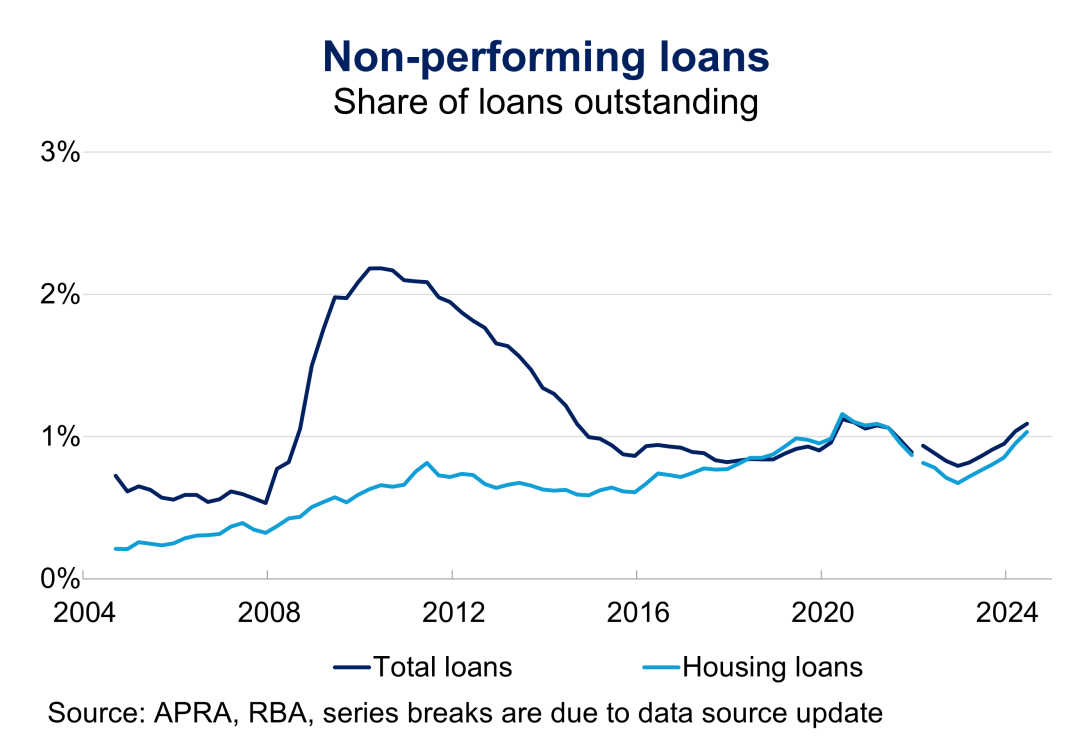
Total non-performing loans (NPLs) have picked up slightly over 2024 from a low base, reflecting high debt servicing costs and cost of living pressures (Chart 4.2). Loan quality may deteriorate further, particularly if labour market conditions weaken materially more than currently expected. Australian banks remain well-capitalised and provisioned to withstand further deterioration in asset quality.
The risk environment and macroprudential policy settings are under regular review and APRA will adjust its settings to respond to emerging risks and to ensure the financial system is able to support the economy by providing credit to households and businesses. Given recent trends and against the background of high household leverage, APRA is closely monitoring growth in housing credit and house prices, and whether a weakening in the labour market is translating into further deterioration in asset quality, such as NPLs. In making its assessment, APRA consults with other agencies on the Council of Financial Regulators (CFR), in line with its macroprudential policy framework.
Macroprudential policy framework
APRA’s macroprudential policy tools aim to mitigate financial stability risks at the system-wide level; the macroprudential policy framework was published in November 2021. Unlike micro-prudential supervision, macroprudential policy tools do not focus on the risk-taking of individual institutions. Rather, they complement APRA’s prudential policy and supervision activities to promote a safe and stable financial system to enable households and businesses to confidently borrow, save and invest for the future. While promoting a financial system that is stable is the primary objective, APRA also considers broader implications of its macroprudential settings, such as on efficiency, competition and access to credit.
APRA’s macroprudential toolkit comprises several core tools: the serviceability assessment buffer; capital-based measures such as the CCyB; and limits on higher-risk forms of lending. Outside of these core credit- and capital-based tools, APRA also has other macroprudential measures available in its toolkit if required, such as liquidity and market-based measures.1 However, this does not preclude the use of additional tools, and APRA will continue to review its toolkit as risks to the financial system evolve over time.
Macroprudential policy plays a role in promoting financial stability through the financial risk cycle. It can lean against excessive risk-taking in an upswing or it can provide support to the financial system, and so the economy, in episodes of extreme risk aversion, where the flow of credit is often disrupted.
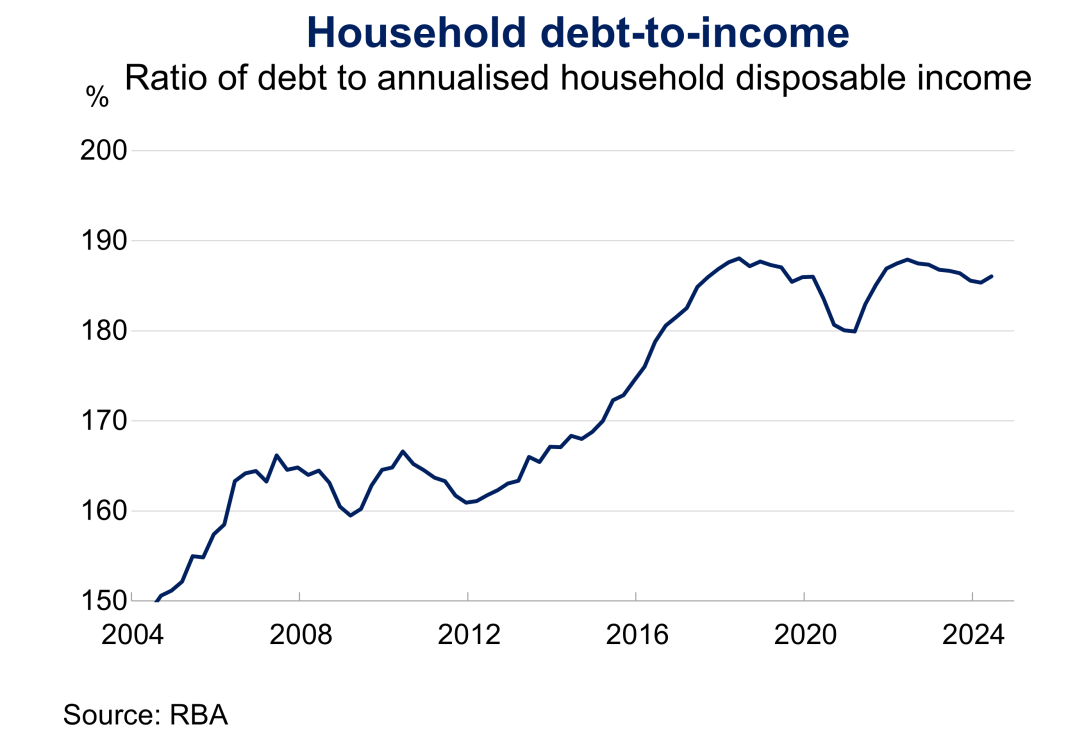
An important mechanism to achieve this is through influencing overall risk-taking and levels of borrower indebtedness. Highly indebted borrowers are more likely to encounter difficulties servicing their debts, particularly in response to shocks to their income or expenses. In the Australian context, household leverage is a key vulnerability. Over the past two decades, Australia’s household debt – most of which is housing debt – has increased from 150 per cent to 190 per cent of household incomes (Chart 1.3). This is markedly higher than in some peer economies, such as Canada, the UK and the USA. Relative to its international peers, the Australian banking system is considerably more concentrated in residential mortgages: these assets account for around two thirds of Australian banks’ exposures. Indeed, results from previous ADI industry stress tests have shown banks’ mortgage portfolios are likely to account for a large share of credit losses in stress, largely due to their size.
When regularly reviewing its macroprudential settings, APRA monitors a range of qualitative and quantitative information to evaluate risks to financial stability. Indicators focus on four key areas that have been shown empirically to highlight emerging systemic risks: credit growth and leverage; asset prices; lending conditions; and indicators of financial resilience. There is no mechanical link between the level or change of any one indicator relative to its history and APRA’s decisions on macroprudential measures. Rather, these indicators help to inform APRA’s assessment of the outlook for financial stability, including whether settings are appropriate for a range of adverse scenarios that could unfold in the near term. In addition, the most appropriate macroprudential tool (or combination of tools) will always depend on the prevailing financial stability risks at the time. In setting macroprudential policy, APRA carefully considers this broad range of information and consults with other agencies on the CFR, to assess financial stability risks and coordinate regulatory responses.
Serviceability assessment buffer
Under APRA’s prudential standard for credit risk management, ADIs must assess all new borrowers’ ability to meet their housing loan repayments at an interest rate that is at least 3.0 percentage points above the loan product rate. This buffer provides an important contingency in the years ahead for shocks to a borrower’s ability to service the loan that may otherwise result in default. These shocks can stem from a range of sources, including a reduction in borrowers’ incomes or an increase in their expenses. They can relate to an individual household’s life circumstances, such as an unforeseen illness, or a change in the broader economic environment such as increases in interest rates, higher inflation, or a weakening labour market. As is the case with all of APRA’s macroprudential tools, the serviceability buffer is calibrated at the system-wide level and will therefore not be appropriate for every lending decision. APRA therefore allows ADIs discretion to make exceptions on a case-by-case basis where it is prudent to do so. Banks used exceptions to serviceability policies for around 5 per cent of new housing loans over the past year, which has increased from 2-3 per cent in the years prior. This reflects in part the high level of refinancing by existing borrowers over that period.
The serviceability buffer builds additional resilience in lenders’ housing loan portfolios to help withstand future stress. It also reduces individual borrowers’ likelihood of entering into mortgage stress in a range of adverse scenarios. In normal times, it maintains system-wide resilience by providing some protection to individual borrowers – and in turn, to lenders’ total housing portfolios – against future serviceability shocks. It can be increased in periods of excessive risk taking to lean against the build-up of housing-related vulnerabilities. It also can be lowered to promote the steady flow of credit to households and to support the real economy in periods where the flow of credit is disrupted.
Capital-based measures
Capital-based macroprudential measures seek to strengthen the financial system’s resilience as systemic risks are building and provide additional support for the banking system to continue to lend to households and businesses during a downturn. The CCyB is a buffer that can be relaxed if needed by APRA in a downturn, to provide banks with flexibility to continue to lend, and in turn, absorb rather than amplify the impact of systemic shocks. The CCyB is currently held at its default setting of 1.0 per cent of risk-weighted assets, providing a buffer for future stress.
APRA also has the capacity to restrict discretionary capital distributions so that banks and insurers can maintain capacity to continue to lend and underwrite insurance in periods of stress. APRA does not currently have such measures in place.
Lending limits
APRA may set limits to restrain forms of higher risk lending temporarily, where these are contributing excessively to financial stability risks. In the past, APRA has set temporary limits on lending for the purposes of investment and lending on an interest-only basis. APRA’s prudential standards require ADIs to be prepared for the introduction of certain limits on residential mortgage lending (e.g. high loan-to-valuation ratio (LVR) and high debt-to-income (DTI) lending) and commercial property lending (e.g. lending for land acquisition, development and construction; and lending for investment). However, this does not preclude the use of limits on other higher risk forms of lending in the future, if required. APRA does not currently have any such limits in place.
Current policy considerations
Serviceability assessment buffer
With continued uncertainty in the outlook for the labour market, inflation and interest rates, APRA considers the current setting of the serviceability buffer at 3 percentage points to be appropriate. The sources of economic uncertainty have shifted over the past year or so, but the risk of shocks for borrowers remains. The risk of persistently higher inflation and further increases in interest rates in the near-term has reduced. Meanwhile, higher unemployment and some persistence in cost-of-living pressures is expected, which present risks to household incomes including if more adverse scenarios eventuated. Risks in the global economic environment which could impact the Australian financial system also remain pronounced, including those from ongoing geopolitical instability.
The setting also takes into account risks to the financial system associated with Australia’s high overall household indebtedness and housing-related vulnerabilities. Against a backdrop of high household indebtedness, the pickup in credit growth over the past year is an area APRA will continue to watch carefully. It is important that the quality of new lending – including the level of the serviceability buffer applied in lending decisions – remains prudent to guard against a future build-up of credit-related vulnerabilities.
While overall, housing credit is growing at around average rates, the serviceability buffer is operating as expected in constraining a small share of borrowers seeking to borrow at (or near) their maximum capacity. As noted above, APRA considers the impact of the serviceability buffer on access to credit, including for FHBs. Currently, the proportion of new lending to FHBs is in line with long-term averages. Further, accumulating sufficient deposit funds remains the primary constraint to prospective FHBs entering the housing market in most instances, reflecting the relatively high level of housing prices.
Countercyclical capital buffer (CCyB)
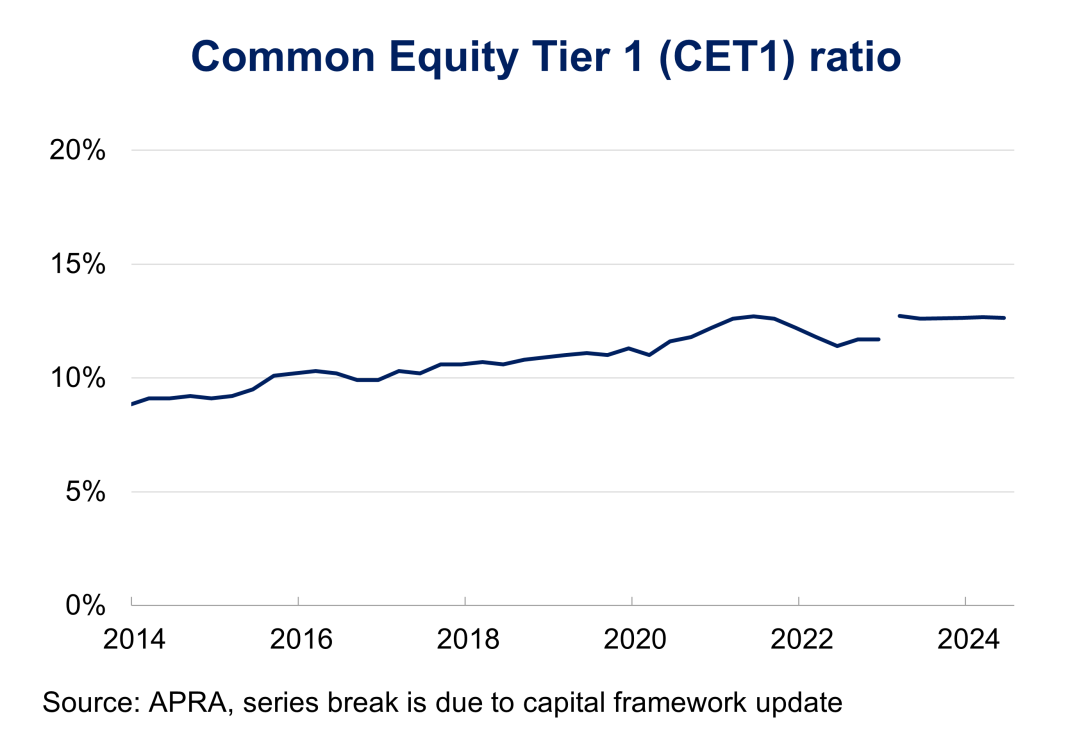
APRA is maintaining the CCyB at 1 per cent of risk-weighted assets, which is consistent with the setting for normal conditions. NPLs have increased slightly (Charts 4.2) alongside high debt servicing costs and costs of living and may continue to rise in the period ahead, particularly if the labour market weakens materially. However, NPLs remain in line with pre-pandemic levels and banks remain well-capitalised to withstand further deterioration in asset quality, with the industry Common Equity Tier 1 (CET1) ratio at 12.7 per cent (Chart 4.1). Further, stress testing results indicate banks have sufficient resilience to continue to lend to households and businesses in a severe downturn. At the same time, growth in credit has picked up and there is no evidence that banks are restricting credit availability.
Lending limits
There are no APRA limits currently in place on higher-risk lending at a system-wide level. Aggregate shares of higher-risk lending remain contained. Supervisors continue to closely monitor higher-risk lending at outlier banks.
In summary, economic and financial indicators suggest that current settings remain appropriate. In particular, credit is growing at around long-term average rates and arrears and NPLs remain low despite recent increases. APRA is carefully monitoring financial conditions as they evolve, assessing emerging vulnerabilities and risks and will adjust macroprudential settings if necessary.
Appendix
APRA tracks a broad range of indicators to monitor risks to the financial system. This includes four main indicators that provide a view of emerging systemic risks: credit growth and leverage; asset prices; lending conditions; and financial resilience. Trends for these select indicators are shown in the charts below.
Systemic Risk Indicators
1. Credit Growth and Leverage
| Chart 1.1: Credit growth | Chart 1.2: Housing credit growth |
|---|---|
 |  |
| Chart 1.3: Household debt to income | Chart 1.4: First home buyers |
|---|---|
 |  |
2. Asset Prices
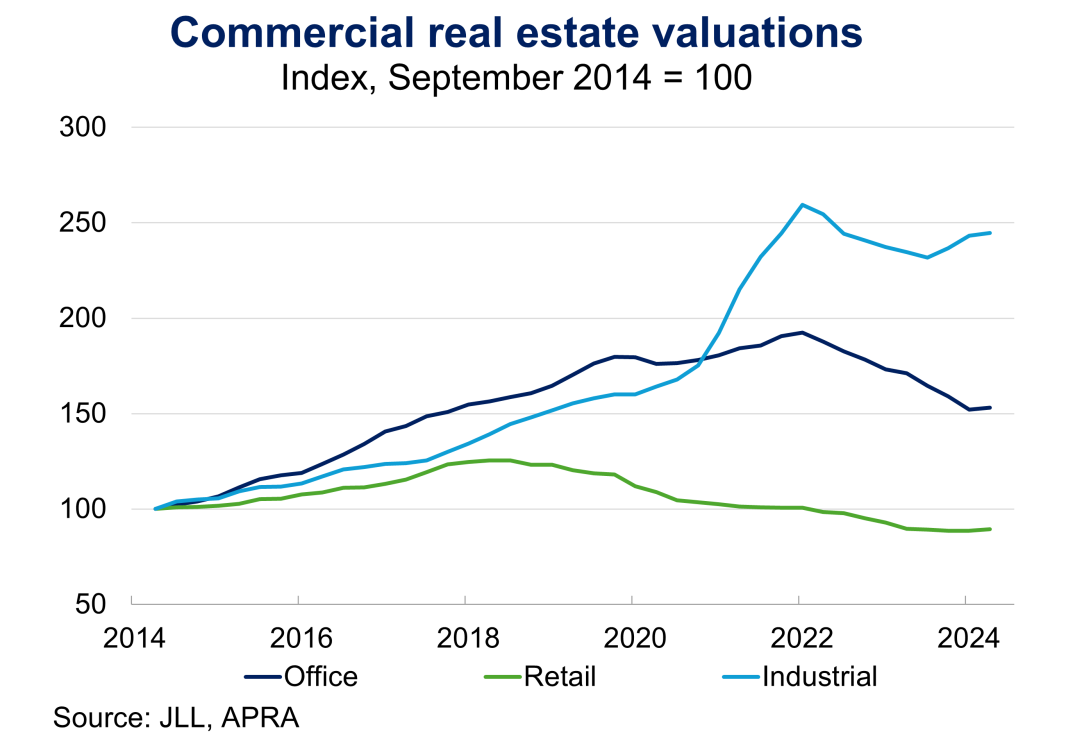
| Chart 2.1: National housing price | Chart 2.2: Commercial real estate valuations |
|---|---|
 |  |
3. Lending conditions
| Chart 3.1: Debt to income ratio greater or equal to 6 times | Chart 3.2: Loan to valuation ratio greater or equal to 90 per cent |
|---|---|
 |  |
4. Financial Resilience
| Chart 4.1: Common equity tier one ratio | Chart 4.2: Non-performing loans |
|---|---|
 |  |