Quarterly superannuation performance statistics highlights - March 2024
Highlights
Industry overview
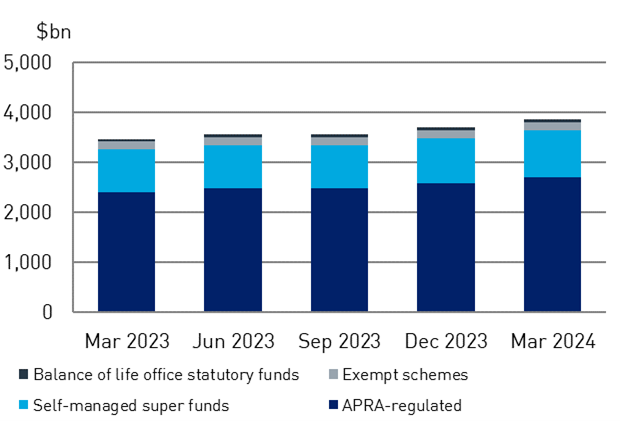
Total superannuation assets increased by 4.2 per cent over the quarter to reach $3.9 trillion at 31 March 2024 (Chart 1). This increase was led by strong growth in APRA-regulated funds, which increased by over 4.8 per cent over the quarter, driven by strong returns from financial markets. Of the total superannuation assets, $2.7 trillion are in APRA-regulated funds.
Chart 1: Assets of superannuation entities
Entities with more than 6 members
The comments below are based on superannuation entities with more than six members.
Contributions, benefit transfers and benefit payments
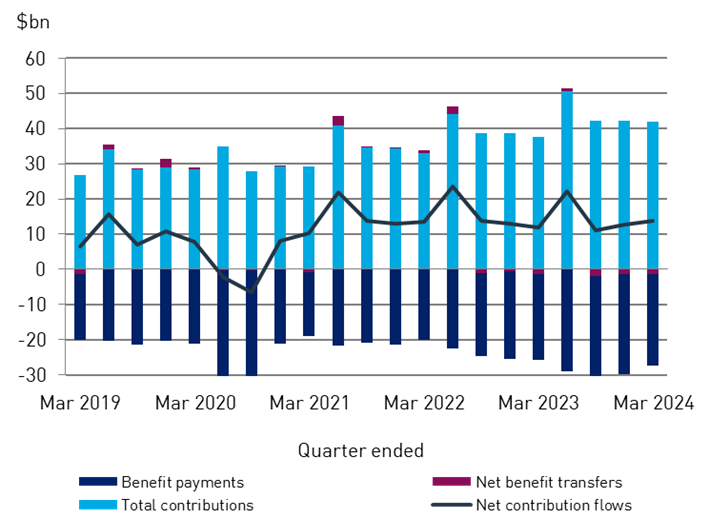
Contributions were $41.9 billion in the quarter and reached $177.0 billion in the year ending March 2024, 11.3 per cent higher than the year to March 2023. Of this, employer contributions were $33.5 billion for the quarter and $133.3 billion for the year ending March 2024, which was 12.4 per cent higher compared to the previous year. The growth in employer contributions over the year was driven by the increase in the Superannuation Guarantee to 11 per cent on 1 July 2023, a 4.2 per cent yearly increase in the Wage Price Index, and a 2.4 per cent yearly increase in the number of people employed. Members contributed $8.4 billion in the quarter and $43.7 billion in the year ending in March 2024, which was 8.2 per cent higher than the previous year.
Benefit payments totalled $26.1 billion for the quarter and increased by 18.1 per cent to $112.9 billion for the year ending in March 2024. This increase is attributable to an 18.4 per cent increase in lump sum payments and a 17.7 per cent increase in pension payments over the year to March 2024. Total benefit payments for the quarter comprised $13.8 billion of lump sum benefit payments and $12.3 billion of pension payments (Chart 2).
Net contribution flows (contributions plus net benefit transfers, less benefit payments) were $13.9 billion in the quarter (Chart 3). Net contribution flows for the 12 months to March 2024 decreased by 3.9 per cent to $59.8 billion.
Chart 2: Benefit Payments
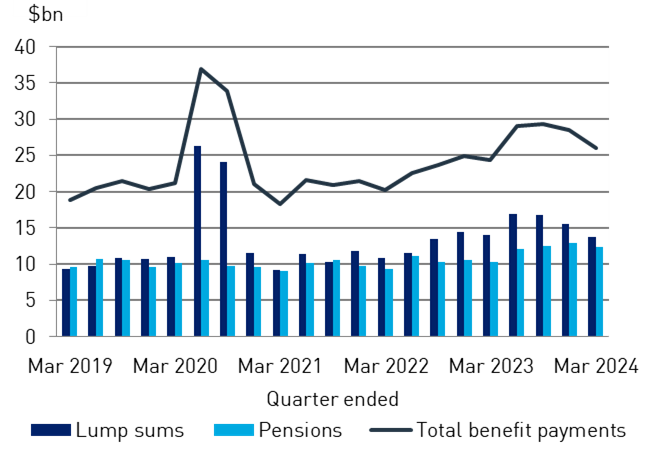
Chart 3: Net contribution flows
Financial performance
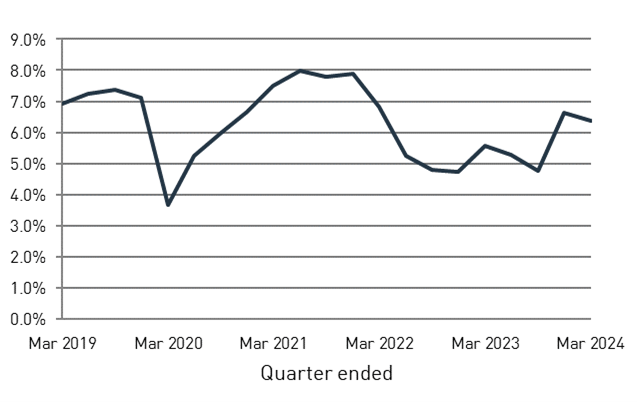
The rate of return (ROR) for entities with more than six members for the March 2024 quarter increased (Chart 4) to 4.9 per cent, up from 4.3 per cent in the December 2023 quarter. This high quarterly return was driven by strong growth in financial markets, notably in domestic and international equities which finished the quarter near all-time highs. The ROR for the year ending March 2024 was 10.9 per cent, while the five year annualised ROR to March 2024 was 6.4 per cent (Chart 4).
Chart 4: Five year annualised rate of return