Quarterly superannuation performance statistics highlights - June 2024
Highlights
Industry overview
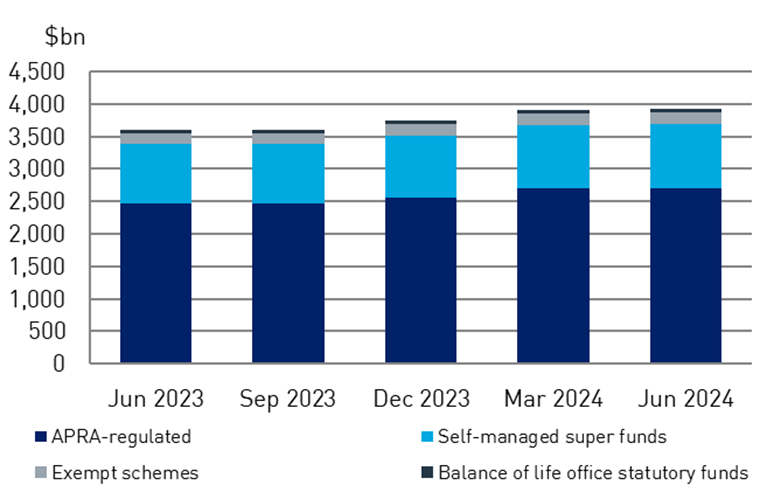
Total superannuation assets increased by 0.4 per cent over the quarter to reach $3.9 trillion as at June 2024 (Chart 1), of which $2.7 trillion are in APRA-regulated funds. The landscape of APRA-regulated assets has shifted, with assets managed by corporate funds decreasing by 18.9 per cent in the year since June 2023, while assets managed by retail and industry funds have increased by 9.6 per cent and 14.1 per cent respectively.
Chart 1: Assets of superannuation entities
Entities with more than 6 members
The comments below relate to superannuation entities with more than six members.
Contributions, benefit transfers and benefit payments
Contributions were $57.2 billion in the quarter and reached $183.9 billion in the year ending June 2024, 11.2 per cent higher than the year to June 2023. Of this, members contributed $46.9 billion over the year and $18.7 billion in the June quarter, an increase of 120.4 per cent compared to the March quarter. This significant quarterly increase is similar to previous June quarters, likely driven by members making additional contributions to maximise annual contribution limits before the end of the financial year. Employer contributions were $38.5 billion for the quarter and $137.1 billion for the year ending June 2024, which was 11.8 per cent higher compared to the previous year.
Benefit payments totalled $117.7 billion for the year ending in June 2024, a 15.3 per cent increase from the year to June 2023. This increase is attributable to a 23.7 per cent increase in pension payments and a 9.2 per cent increase in lump sum payments over the year to June 2024. Total benefit payments for the quarter was comprised of $16.9 billion of lump sum benefit payments and $15.5 billion of pension payments (Chart 2).
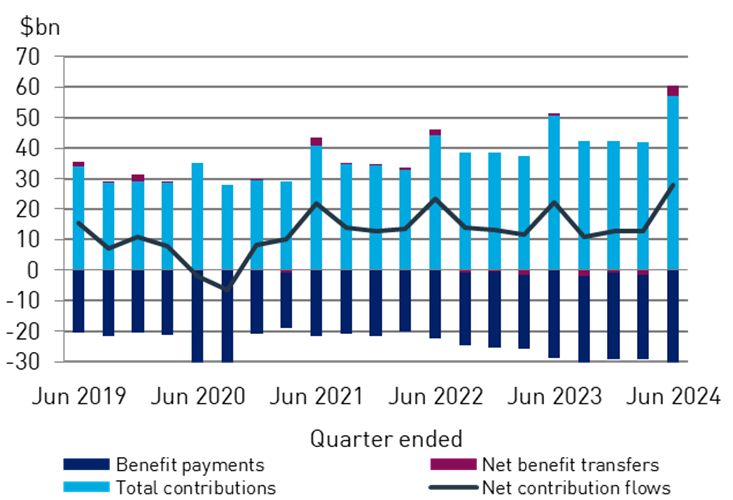
Net contribution flows (contributions plus net benefit transfers, less benefit payments) were $28.0 billion in the quarter (Chart 3). Net contribution flows for the 12 months to June 2024 increased by 5.6 per cent to $64.5 billion.
Chart 2: Benefit Payments
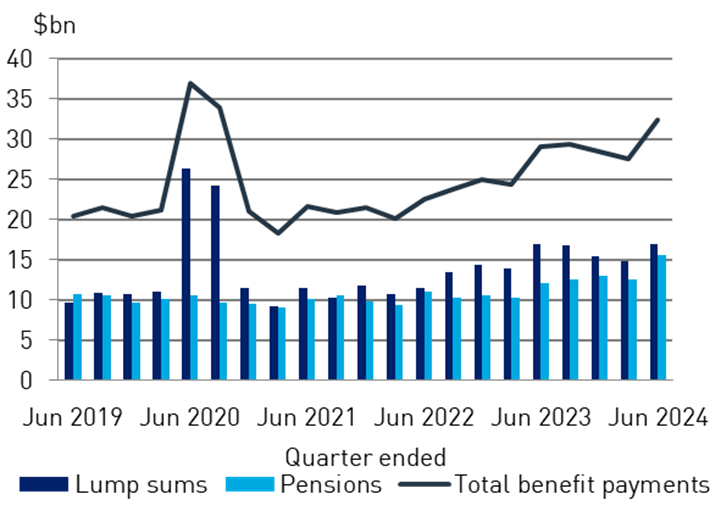
Chart 3: Net contribution flows
Financial performance
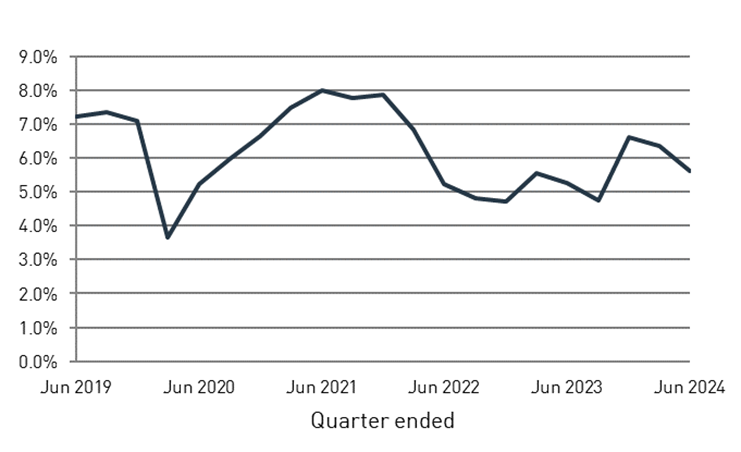
The five year annualised rate of return (ROR) as at June 2024 was 5.6 per cent (Chart 4), an increase of 0.3 per cent from June 2023. The ROR for the year ending June 2024 was 8.8 per cent.
Chart 4: Five year annualised rate of return