Quarterly superannuation performance statistics highlights - December 2024
Highlights
Industry overview
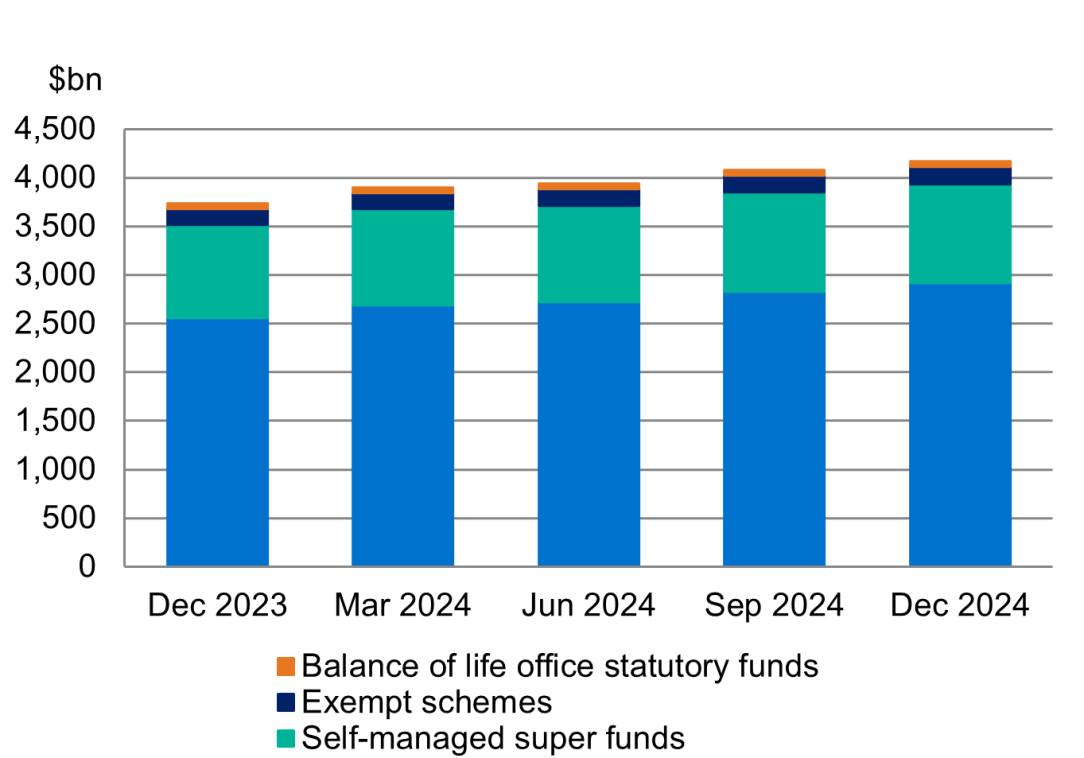
Total superannuation assets increased by 2.1 per cent over the quarter to reach $4.2 trillion as at December 2024 (Chart 1), of which $2.9 trillion was in APRA-regulated funds. Superannuation returns were strong over the last 12 months, with an 11.1 per cent return in the year to December 2024.
Chart 1: Assets of superannuation entities
Entities with more than 6 members
The comments below relate to superannuation entities with more than six members.
Contributions, benefit transfers and benefit payments
Total contributions were $49.1 billion for the quarter and reached $198.1 billion in the year ending December 2024, an increase of 14.8 per cent from the previous year. Employer contributions were $37.3 billion for the quarter and $129.9 billion for the year ending December 2024, 10.8 per cent higher compared to the previous year. The annual growth included the effect of an increase in the super guarantee contribution rate from 11.0 per cent to 11.5 per cent starting July 2024. Member contributions were $11.8 billion for the quarter and $54.1 billion for the year ending December 2024, 26.7 per cent higher than the previous year. The increase was driven by growth in personal contributions.
Benefit payments totalled $124.4 billion for the year ending December 2024, a 12.0 per cent increase from the previous year. The increase was attributable to a 17.5 per cent increase in pension payments and a 7.8 per cent increase in lump sum payments over the year ending December 2024. Total benefit payments for the quarter comprised $18.5 billion of lump sum benefit payments and $14.4 billion of pension payments (Chart 2).
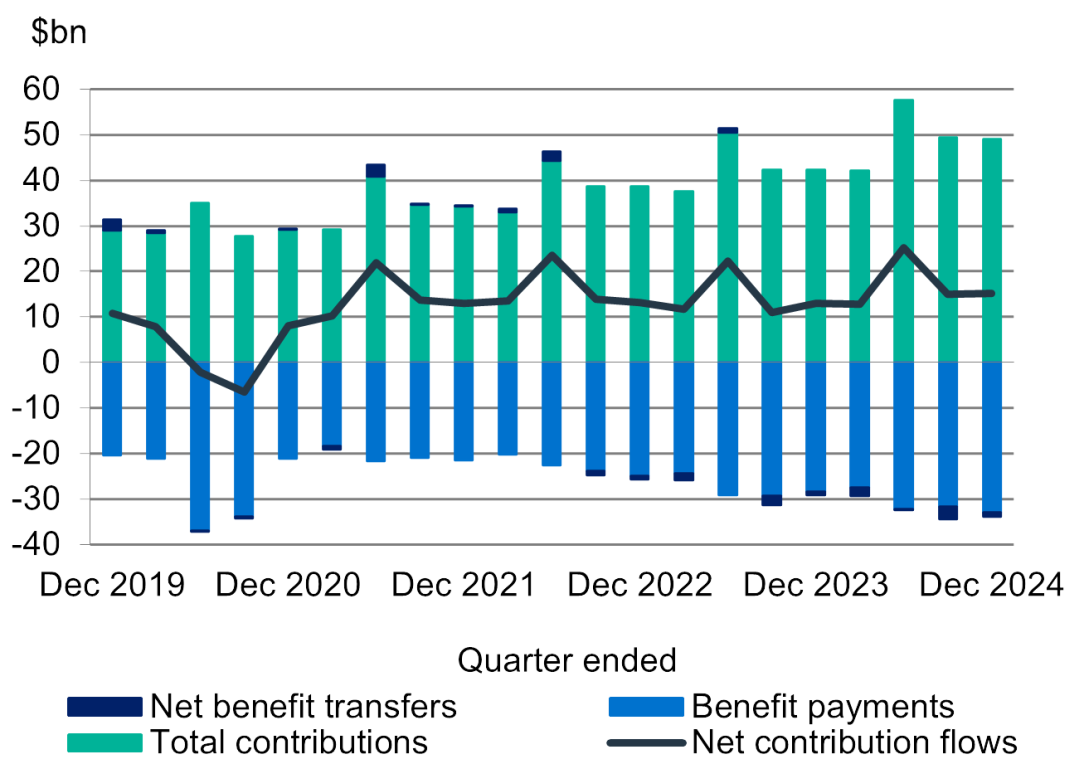
Net contribution flows (contributions plus net benefit transfers, less benefit payments) were $15.1 billion in the quarter (Chart 3). Net contribution flows for the 12 months to December 2024 increased by 17.5 per cent to $68.2 billion.
Chart 2: Benefit Payments
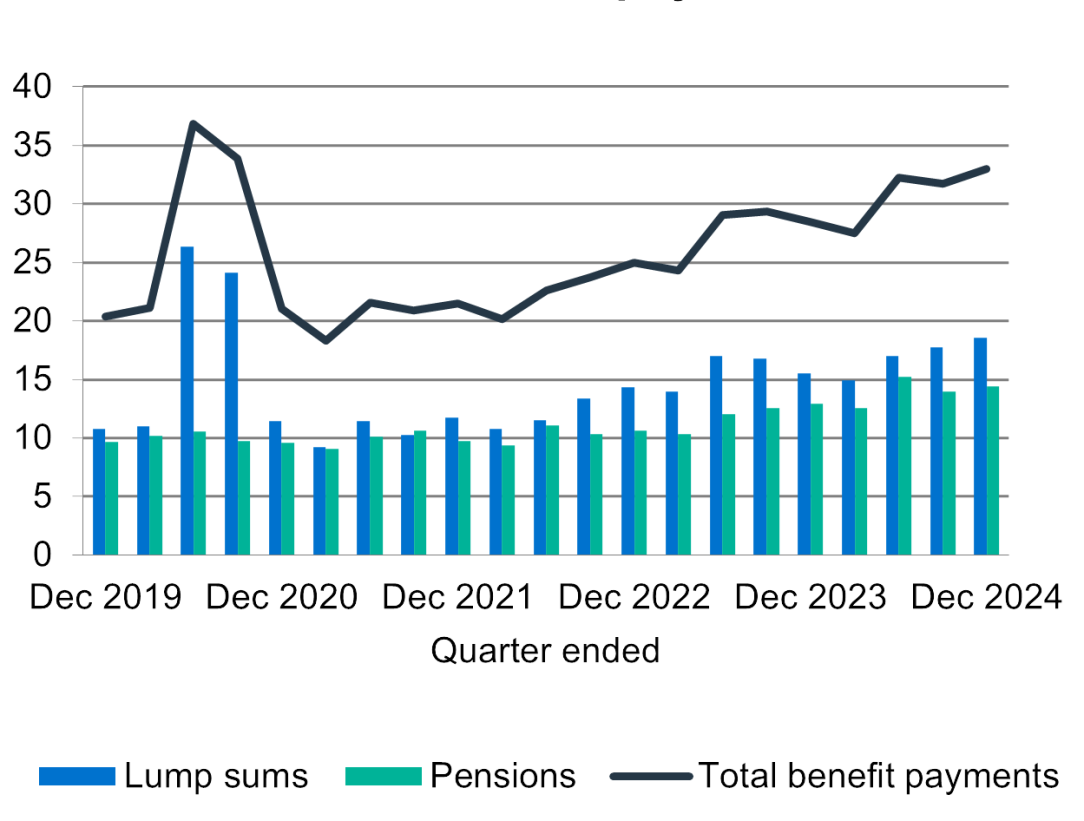
Chart 3: Net contribution flows
Financial performance
The five-year annualised rate of return (ROR) to December 2024 was 6.0 per cent (Chart 4). The ROR for the year ending December 2024 was strong at 11.1 per cent.
Chart 4: Five-year annualised rate of return

Disclaimer and Copyright
While APRA endeavours to ensure the quality of this publication, it does not accept any responsibility for the accuracy, completeness or currency of the material included in this publication and will not be liable for any loss or damage arising out of any use of, or reliance on, this publication.
© Australian Prudential Regulation Authority (APRA) 2024
This work is licensed under the Creative Commons Attribution 4.0 Licence (CCBY 4.0). This licence allows you to copy, redistribute and adapt this work, provided you attribute the work and do not suggest that APRA endorses you or your work. To view a full copy of the terms of this licence, visit: https://creativecommons.org/licenses/by/4.0/