Quarterly private health insurance membership and benefits summary - June 2024
Key metrics
Hospital treatment membership
General treatment membership
Hospital treatment episodes
General treatment services (ancillary)
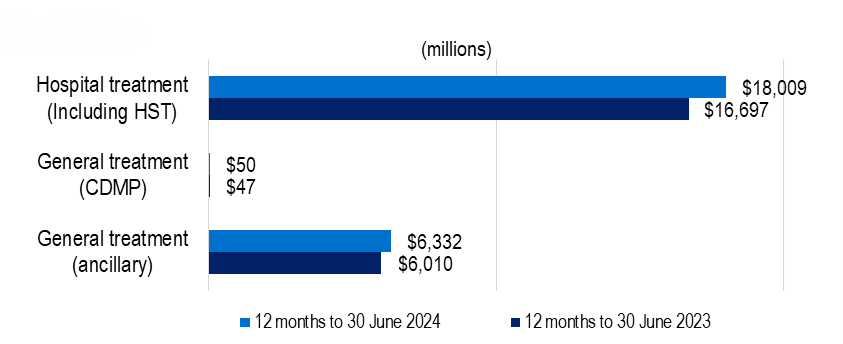
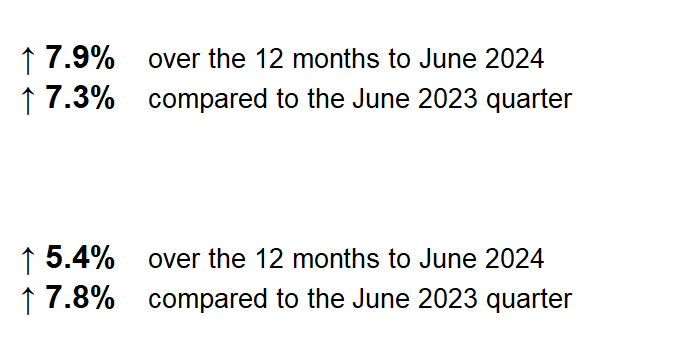
Benefits
 |  |
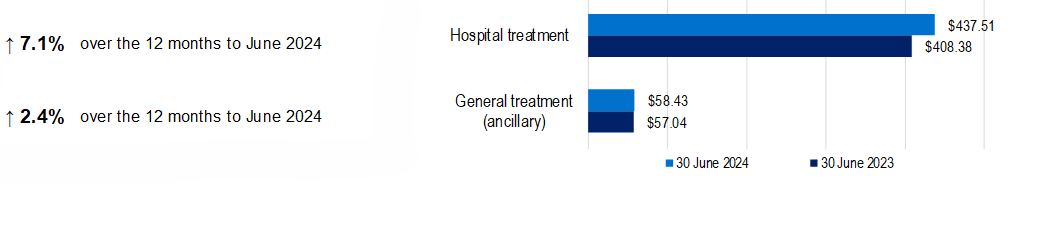
Out-of-pocket per episode/service
Membership and coverage
as at 30 June 2024
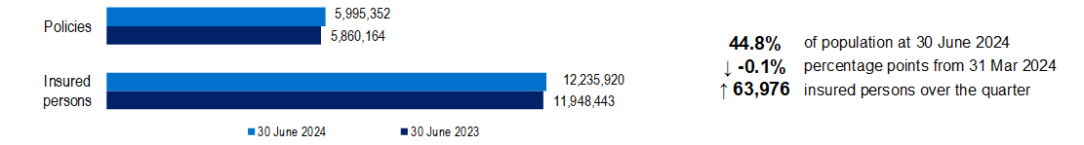
Hospital Treatment
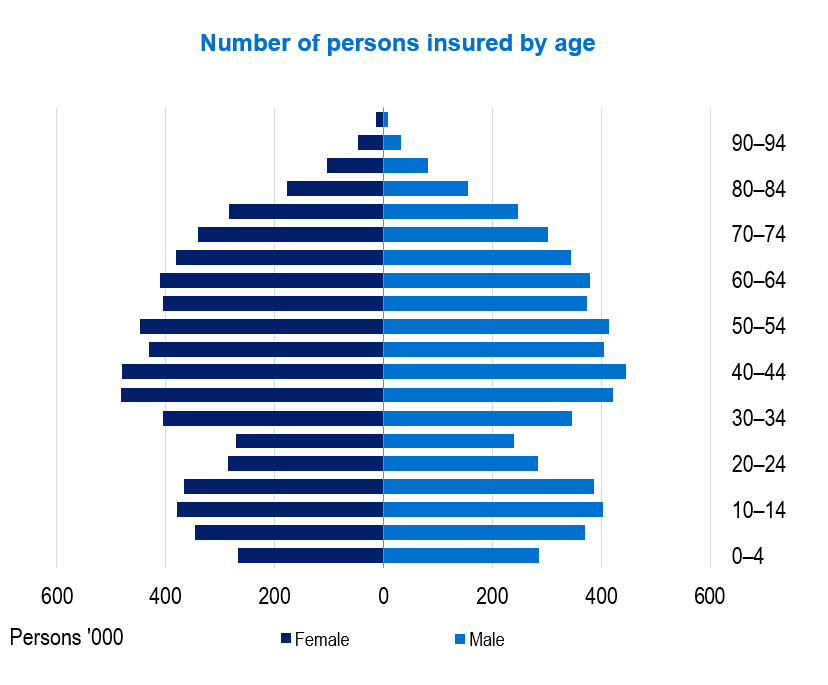
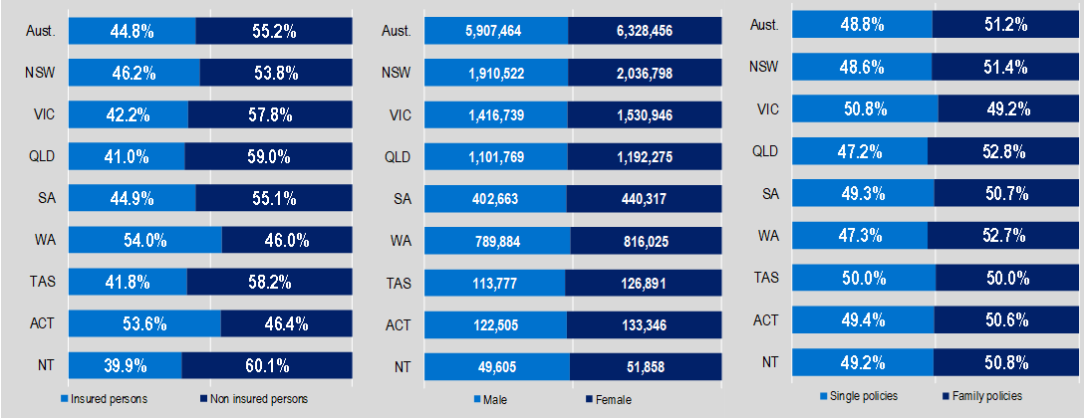
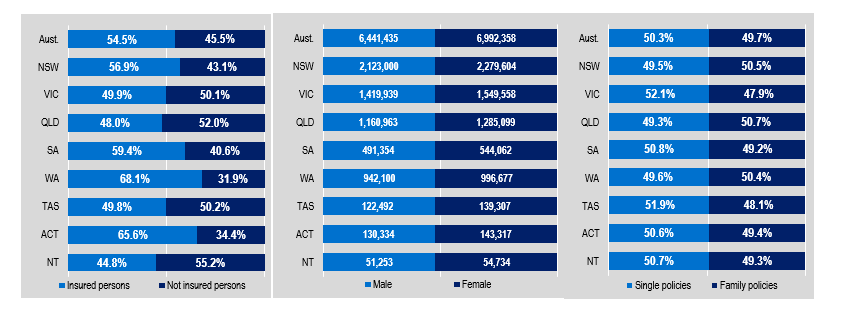
At 30 June 2024, 12,235,920 people, or 44.8% of the population, were covered by hospital treatment cover. There was a slight decrease compared to March 2024.
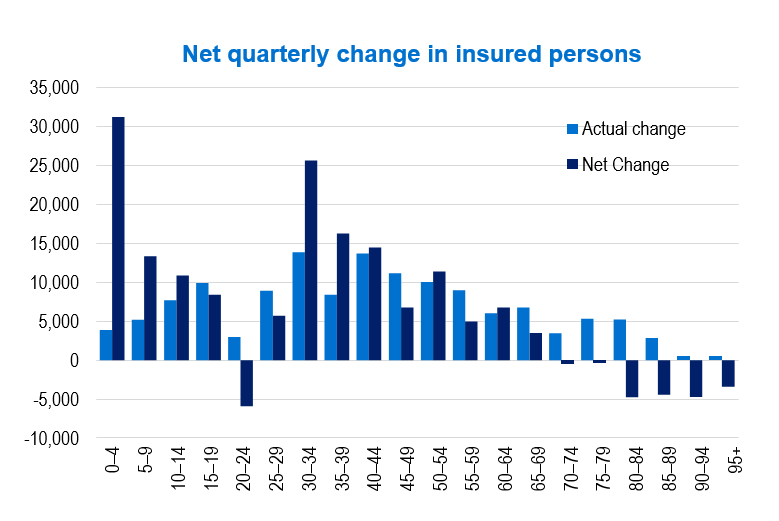
There was an increase in coverage of 63,976 insured people in the June 2024 quarter compared to March 2024. Family policies increased by 8,688 and single policies by 17,197 during the quarter.
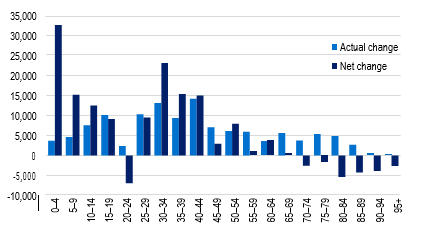
The largest increase in coverage during the quarter was 13,887 for people aged between 30 and 34. The largest net increase (taking into account movement between age groups) was for the 0-4 with an increase of 31,271 people.
Lifetime health cover
The majority of adults with hospital cover (88.4%) have a certified age of entry of 30, with no penalty loading.
At the end of the 30 June 2024 quarter, there were 1,023,348 people with a certified age of entry of more than 30 and subject to a Lifetime Health Cover loading; a net increase in people paying a penalty over the preceding 12 months of 66,787. There was a net increase in people with a certified age of entry of 30 (with no penalty) over the year of 113,873. Over the year, 123,929 people had their loading removed after paying a loading for ten years.
Hospital treatment tables
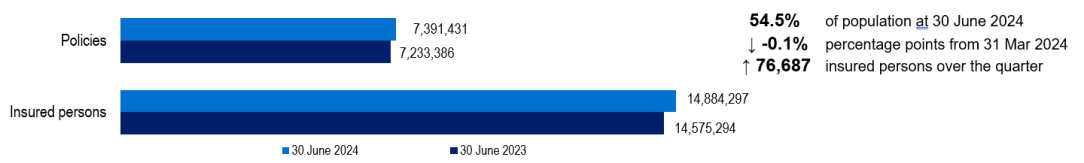
General treatment
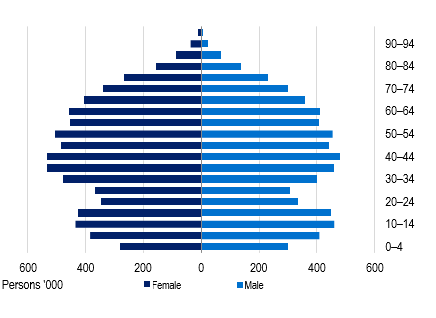
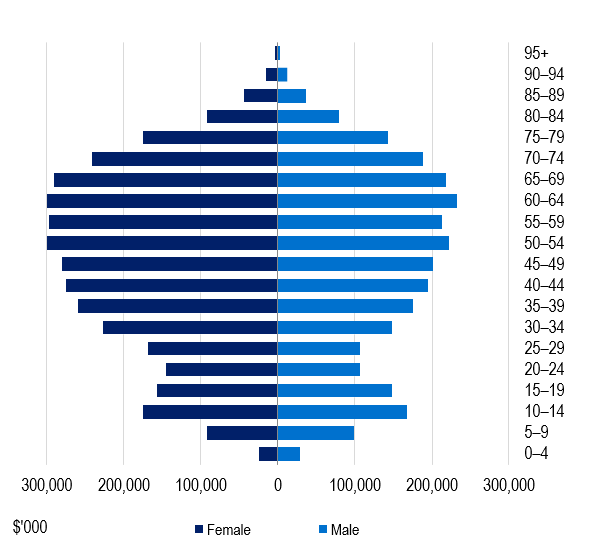
At 30 June 2024, 14,884,297 people or 54.5% of the population had some form of general treatment cover. There was an increase of 76,687 people when compared to the March quarter. There was an increase of General Treatment policies of 39,237 for June 2024 which was mainly driven by Single Policies which increased by 22,899. For the 12 months to 30 June 2024, the number of insured persons with general treatment cover has increased by 309,003.
The general treatment (ancillary) by age charts and data in this report show data for those people that have general treatment policies covering ancillary services, regardless of other treatment included in the product. This excludes those general treatment policies that do not cover ancillary treatment.
There was an increase of 120,591 people with general treatment (ancillary) coverage in the June 2024 quarter. The largest net increase in coverage, after accounting for movements across age groups, was 32,525 for people in the 0 to 4 age group.
Net quarterly change in insured persons (ancillary) | Number of persons insured by age (ancillary) |
 |  |
General treatment tables (ancillary)
Benefits paid
Hospital treatment
| Hospital Treatment | June 2024 | Change from March 2024 |
|---|---|---|
| Acute | $2,661 | 2.8% |
| Medical | $66 | 5.4% |
| Medical devices or human tissue products | $653 | 1.1% |
| Cardiac | $3,211 | 0.9% |
| Hip | $1,615 | -0.8% |
| Knee | $1,655 | -0.7% |
|
| |
| Hospital | $4,819,539,376 | 12.6% |
| General | $1,620,521,729 | -2.8% |
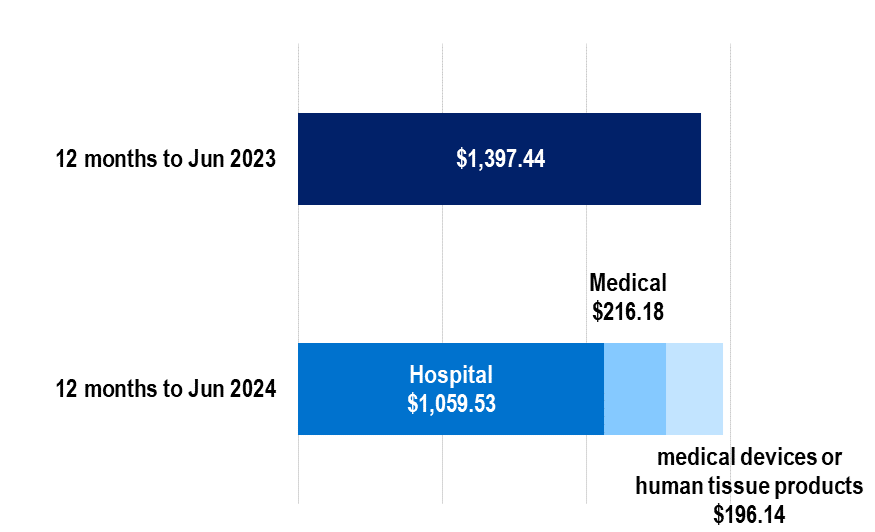
During the June 2024 quarter, insurers paid $4,820 million in hospital treatment benefits, which was 12.58% higher compared to the March 2024 quarter. Hospital treatment benefits were comprised of:
- $3,495 million for hospital services such as accommodation and nursing
- $683 million for medical services
- $642 million for medical devices or human tissue items.
Hospital treatment benefits paid by age 12 months to 30 June 2024
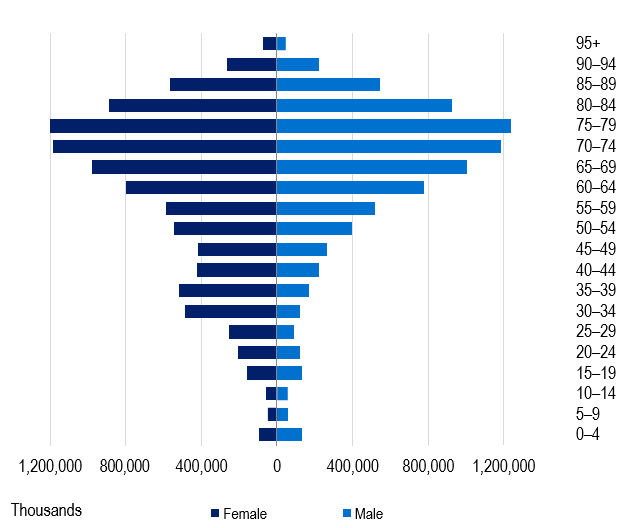
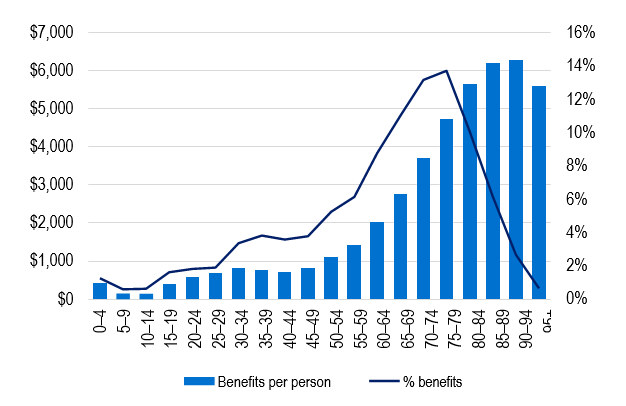
The age group for which most hospital benefits are paid is between 75 and 79 (top chart). Total benefits by age group is affected by the average benefits paid per person (displayed in the second chart) and the number of people in each age group.
Average hospital benefits per person increased from $1,397.44 for the year ending June 2023 to $1,471.85 for the year ending June 2024. The largest amount of benefits per person was spent on hospital accommodation and medical, followed by medical services and then prostheses benefits.
Hospital treatment benefits per person covered and percentage of benefits paid by age cohort | Hospital treatment benefits per person |
 |
|
General treatment
Benefits per service
| June 2024 | Change from March 2024 | |
|---|---|---|
| Dental | $66 | -4.5% |
| Chiropractic | $35 | -3.3% |
| Physiotherapy | $41 | -3.8% |
| Optical | $82 | -2.1% |
During the June 2024 quarter, insurers paid $1,612 million in general treatment (ancillary) benefits. This was a decrease of 2.7% compared to the March 2024 quarter. Ancillary benefits for the June 2024 quarter included the major categories of:
- Dental $901.2 million
- Optical $226.6 million
- Physiotherapy $127.6 million
- Chiropractic $82.5 million
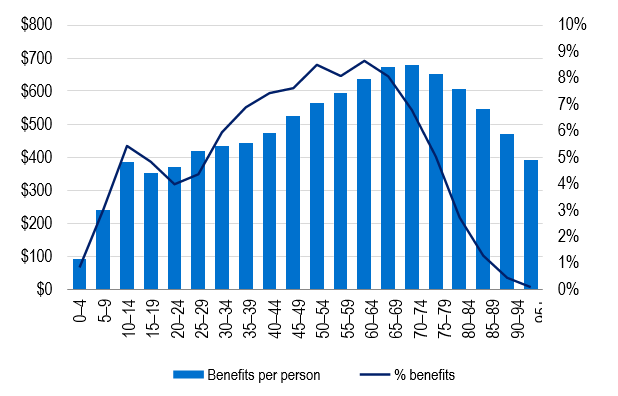
General treatment benefits paid by age 12 months to 30 June 2024 (ancillary)
There is a marked difference between the distribution of benefits over age groups between hospital benefits and ancillary benefits. The major difference is the higher claiming rate in older age groups for hospital benefits while benefits per person for ancillary benefits are more evenly spread over the age groups.
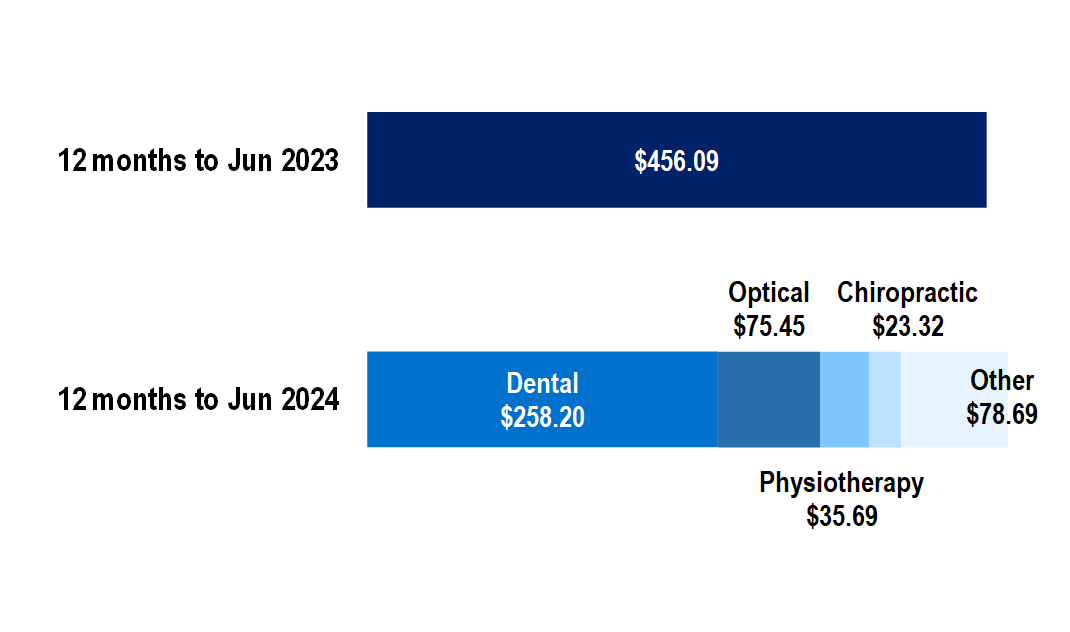
General treatment (ancillary) benefits per person during the year to June 2023 were $456.09 increasing to $471.34 for the year to June 2024. The largest component of ancillary benefits is dental, for which $258.20 was paid per insured.
General treatment benefits per person covered and percentage of benefits paid by age cohort (ancillary) | General treatment benefits per person (ancillary) |
 |
|
Medical benefits
Total benefits for medical services increased 8.9% during the June quarter 2024.
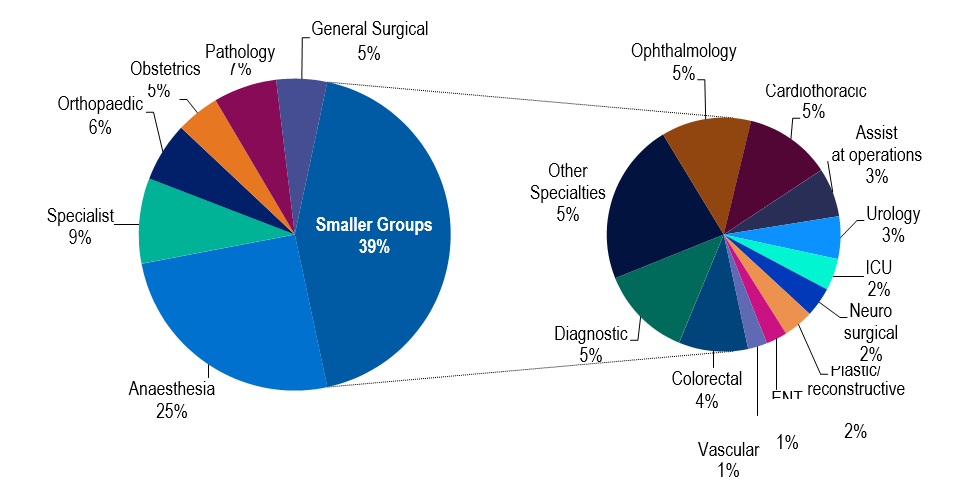
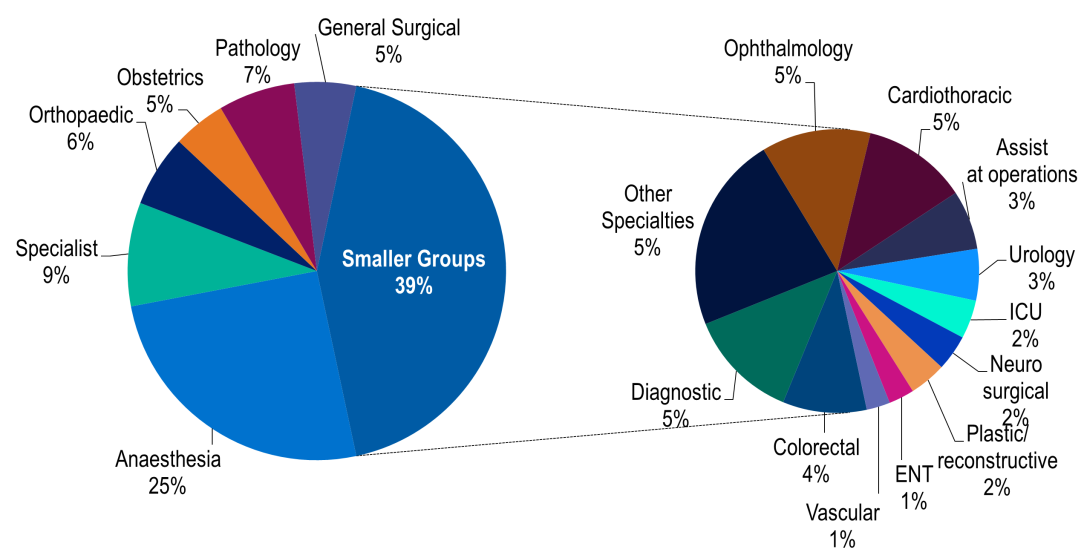
The change in medical benefits paid per service was calculated over a range of medical services and does not mean medical services overall decreased or increased in cost. The average benefits paid reflects the type of medical services utilised during the quarter as well as the volume of services. The medical service for which the greatest amount of benefits was paid was anaesthetics, comprising 25.4% of all medical benefits and totalling $173.19 million.
Medical devices or human tissue benefits
Total benefits paid for medical devices or human tissue products increased by 14.1% in June 2024 compared to March 2024. Similar to medical services, the change in benefits paid for medical devices or human tissue products was calculated over a range of medical devices or human tissue products (see chart) and does not mean medical devices or human tissue products overall changed in cost. The change in benefits paid may reflect a change in the type of prosthetics utilised, or a change in the overall utilisation of medical devices or human tissue products . The medical devices or human tissue products group for which the greatest amount of benefits were paid was cardiac, comprising 17.7% of all medical devices or human tissue products benefits and totalling $113.83 million.
Medical benefits by speciality group
Benefits paid for medical devices or human tissue products
Service utilisation
Episodes/Services by type
| June 2024 | Change from March 2024 | |
|---|---|---|
| Hospital Episodes | 1,313,463 | 9.8% |
| Hospital Days | 3,317,392 | 10.6% |
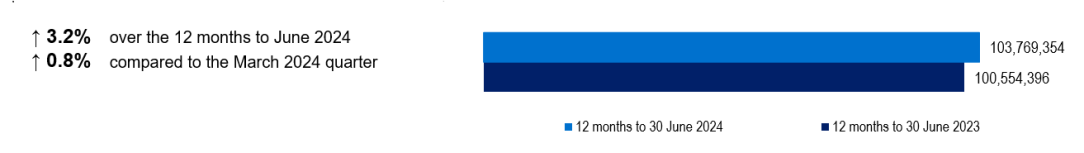
| Medical Services | 10,293,461 | 3.7% |
| Medical devices or human tissue Item | 982,986 | 13.5% |
| Specialist Orthopaedic | 186,933 | 16.5% |
| Ophthalmic | 118,078 | 19.0% |
| Spinal | 61,151 | 10.9% |
| General Treatment | 26,499,138 | 0.8% |
| Dental | 13,564,680 | 6.0% |
| Chiropractic | 2,367,834 | -1.6% |
| Physiotherapy | 3,133,511 | 2.4% |
| Optical | 2,762,916 | -15.8% |
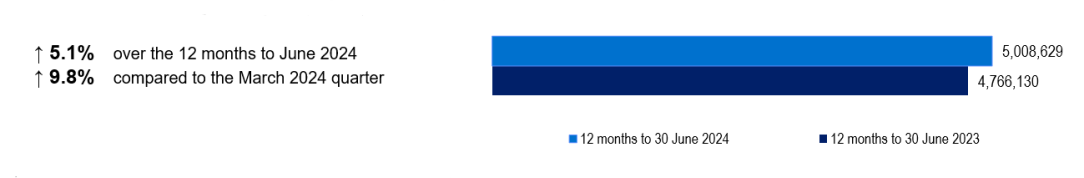
During the June 2024 quarter, insurers paid benefits for 3.3 million days in hospital, arising from 1.3 million hospital episodes of care.
Hospital utilisation is distributed over four categories of hospital—public, private, day only facilities and hospital-substitute. During the June 2024 quarter, hospital episodes were distributed as follows:
- public hospitals 190,507 episodes
- private hospitals 883,885 episodes
- day hospital facilities 175,833 episodes
- hospital substitute 63,238 episodes.
For the June 2024 quarter, hospital utilisation (measured in episodes) increased by 9.8% which was mainly driven by hospitals-substitute.
| Quarter change | Year change | |
|---|---|---|
| public hospitals | ↑ 7.4% | ↑ 9.3% |
| private hospitals | ↑ 10.0% | ↑ 4.9% |
| day hospital facilities | ↑ 10.9% | ↑ 2.6% |
| hospital-substitute | ↑ 11.1% | ↑ 2.6% |
Day-only episodes in the four categories of hospital totalled 910,671 with a 10.1% change compared to March 2024.
Hospital treatment services per 1,000 insured persons | General treatment services (ancillary) per 1,000 insured persons |
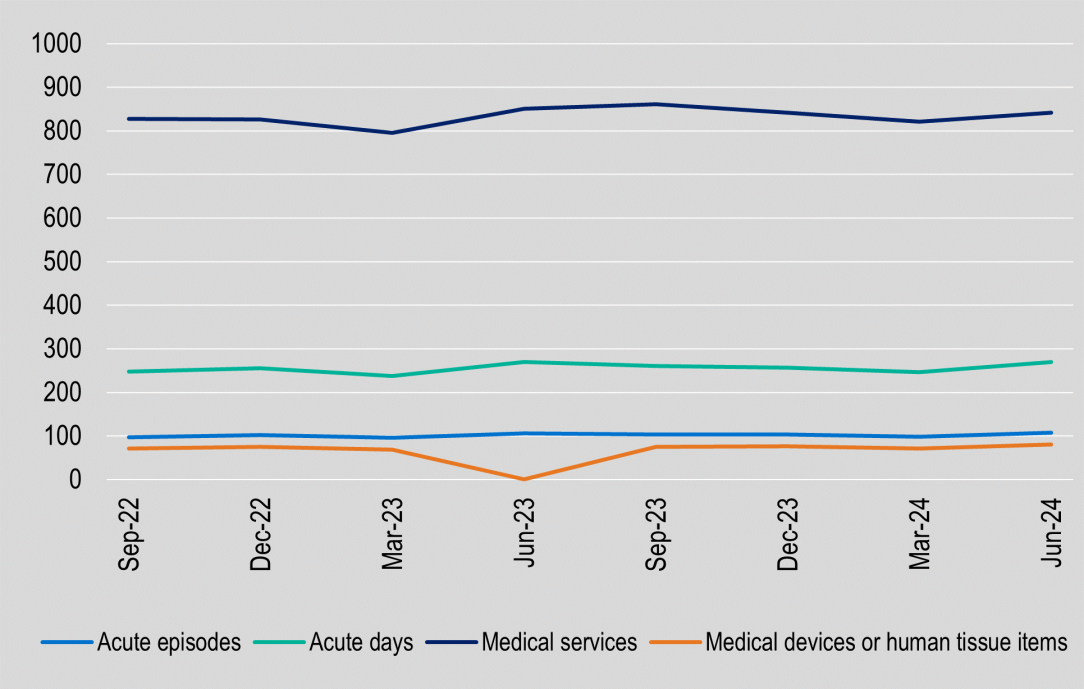 | 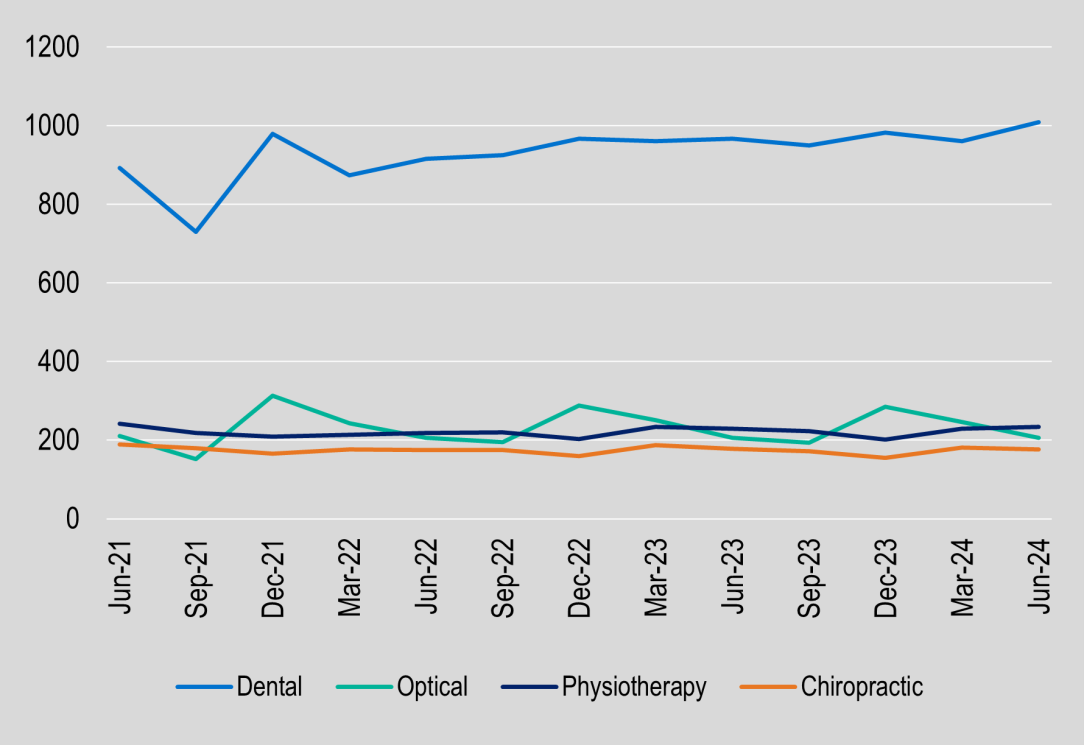 |
Out-of-pocket payments
Average out-of-pocket per episode/service
| June 2024 | Change from March 2024 | Change from June 2023 | |
|---|---|---|---|
| Hospital treatment | $437.51 | 4.9% | 7.1% |
| Hospital-substitute treatment | $3.37 | -17.9% | 16.0% |
| General treatment ancillary | $58.43 | -0.4% | 2.4% |
| Medical gap where gap was paid | $268.04 | 5.5% | 4.5% |
The average out-of-pocket (gap) payment for a hospital episode was $437.51 in the June 2024 quarter. This included out-of-pocket payments for medical services, in addition to any excess or co- payment amounts relating to hospital accommodation.
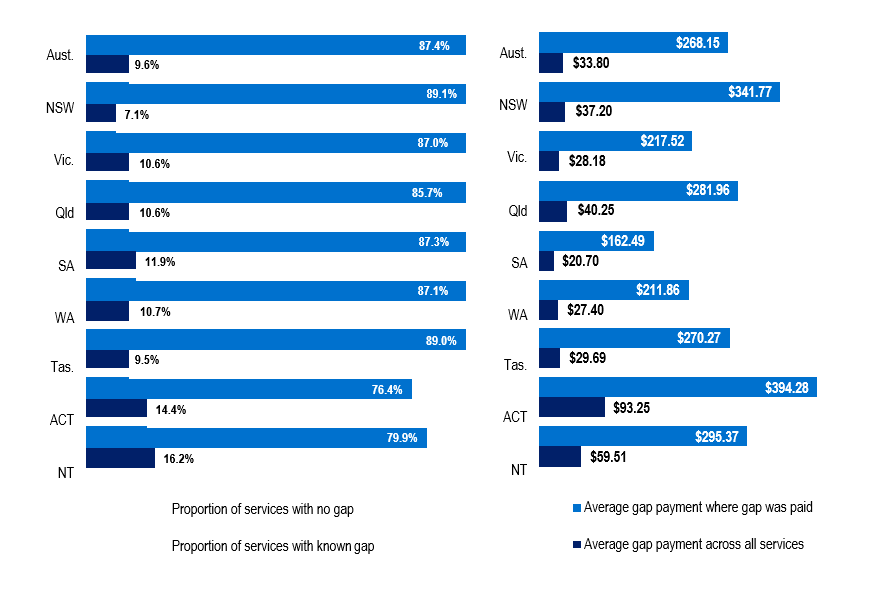
The out-of-pocket payments for hospital episodes increased by 7.1% compared to the same quarter for the previous year. Out-of-pocket payments for medical services were $256.52 where an out-of-pocket payment was payable. The amount of gap for medical services varies depending on the specialty group. The specialty group with the largest out-of-pocket payment was Orthopaedic with an average gap of $713.01. Gap incurred for the various medical services is displayed in the first chart. Medical gap also varies by state and territory and these differences are shown in the bottom chart.
Medical benefits and out-of-pocket by specialty group
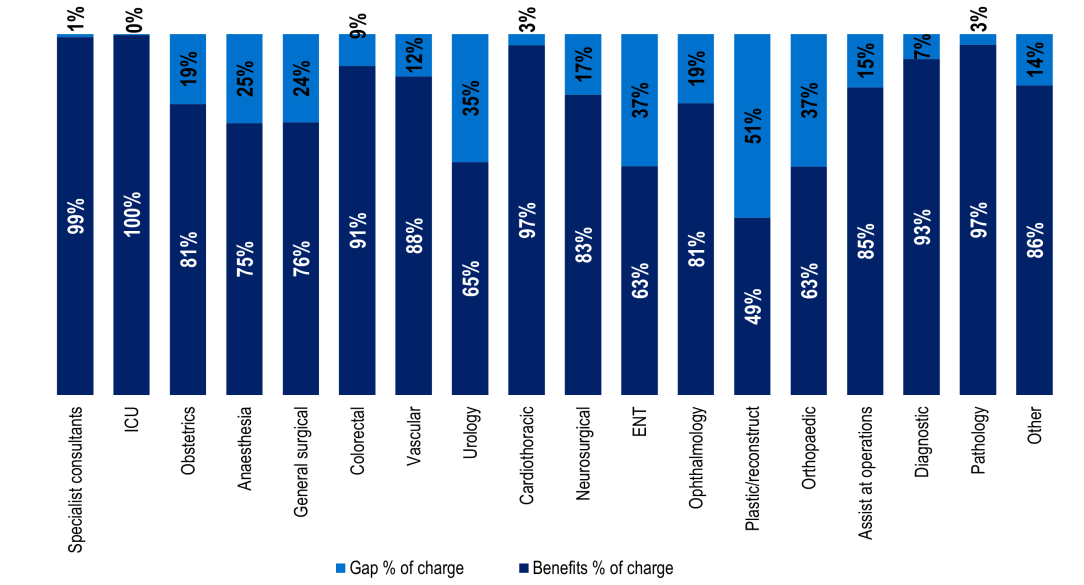
Proportion of services and average out-of-pocket payments
Notes on statistics
Source of data
On 1 July 2015, supervisory responsibilities were transferred from the Private Health Insurance Administration Council (PHIAC) to APRA under the Private Health Insurance (Prudential Supervision) Act 2015 .
This publication is compiled primarily from regulatory returns submitted to APRA under the Financial Sector (Collection of Data) Act 2001
by authorised Private Health Insurance companies.
Prior to 1 July 2015, PHIAC collected data from Private Health Insurers.
The population figures used to calculate coverage are derived from:
Australian Bureau of Statistics, Australian Demographic Statistics, ABS cat no. 3101.0, ABS, Canberra.
The June 2019 quarterly release of Australian Demographic Statistics contains the most recent estimates of the resident populations (ERP) of Australia and the states and territories based on the results of the 2019 Census of Population and Housing held on 9 August 2016. For more information refer to the publication at the ABS website.
Net change by five year age group is the actual change adjusted for the number of people moving into the cohort and out of the cohort due to ageing. The calculation makes the simplifying assumption that the number of people are evenly distributed over each year within the five year age group.
Lifetime Health Cover is a financial loading (LHC loading) that can be payable in addition to the premium for your private health insurance hospital cover (hospital cover). LHC loadings apply only to hospital cover. The loading is 2% above the base rate for each year over the age of 30 in which the policy holder did not have private health insurance hospital cover. After ten years of paying the loading the loading is removed.
Starting from 1 April 2007, general treatment policies replaced ancillary policies. General treatment policies cover treatment similar to that previously known as ancillary (eg. dental) but can also cover hospital-substitute treatment and Chronic Disease Management Programs.
"APRA replacing any references to the terms prosthesis, prostheses and prosthetic with medical device/s or human tissue product/s effective from 31 March 2024, to ensure consistency between the terminology used in the updated PHI legislation and APRA reporting standards below.
Reporting Standard HRS 601.0 Statistical Data by State (HRS 601.0);
Reporting Standard HRS 603.0 Statistical Data on Prosthetic Benefits (HRS 603.0); and Reporting Standard HRS 605.0 Private Health Insurance Reform Data Collection (HRS 605.0)."
Related Publications
Quarterly publications
A number of related quarterly publicatons are available from: https://www.apra.gov.au/publications
These include:
The Quarterly Statistics are principal release of statistics with summaries for the key financial and membership statistics of the Private Health Insurance industry.
A publication which details by State the number of insured persons for hospital treatment and general treatment and the proportion of the population these persons represent. The tables are shown on both a quarterly and an annual basis and include hospital treatment by age cohort.
A publication on in-hospital medical services. The proportion of services for which there was no gap or known gap and the average gap payment are shown for each state.
Private Health Insurance Membership and Benefits (formerly PHIAC A)
A publication detailing by State, the membership and benefits paid by private health insurers for the period. These State reports are available both in PDF format and Excel.
Medical Devices or Human Tissue Products Statistics
A report providing data on prosthetic benefits paid by private health insurers by major prosthetic category
A report providing data on services, benefits paid and gap payments by MBS Specialty Block Groupings for medical services paid by private health insurers.
Statistical Trends - Quarterly Statistical trends in membership and benefits paid
These are two separate publications detailing trends since September 1997 in the number of insured persons and benefits paid for hospital and general treatment.
Annual publications
APRA will continue to produce an Annual Report on the Operations of the Private Health Insurance Industry. This report contains an industry overview and tables of statistics by individual fund. Current and historical versions are available at: