Quarterly authorised deposit-taking institution property exposure statistics - highlights
Key messages
- Banks’ housing credit growth increased for both owner-occupiers and investors, notwithstanding the higher interest rate environment. The quality of new lending remained sound, with the share of lending at high loan-to-valuation (LVR) and high debt-to-income (DTI) ratios low and stable.
- Housing asset quality remained sound and borrowers remained resilient. The share of loans that are non-performing continued to increase, driven by sustained high debt servicing costs and cost of living pressures. However, this cohort remains a very small part of the banks’ portfolios. Early-stage arrears, loans 30-89 days past due, had the largest quarterly decrease since September 2022, partially due to seasonal factors.
- Commercial real estate lending growth increased, driven by industrial property, as well as stronger growth in the retail and office property sectors. Asset quality remains sound, with a small increase in non-performing loans.
Residential mortgages: credit growth and new lending
Housing credit growth increased, despite the higher interest rate environment.
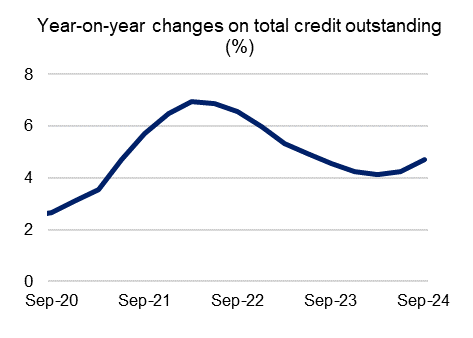
- The growth rate of ADIs’ residential mortgage credit increased and is well above the rate observed before the pandemic. Total mortgage credit grew by 4.7 per cent over the year to September 2024. This is well above the pre-pandemic level of around 2.5 per cent.
- Credit growth for owner-occupiers was slightly higher than for investors, although the gap continued to narrow reflecting faster growth in new investor lending. ADIs’ owner-occupied credit grew by 5.2 per cent over the year, while investor credit grew by 4.7 per cent.
While new lending growth was driven by investors, owner-occupier activity also increased.
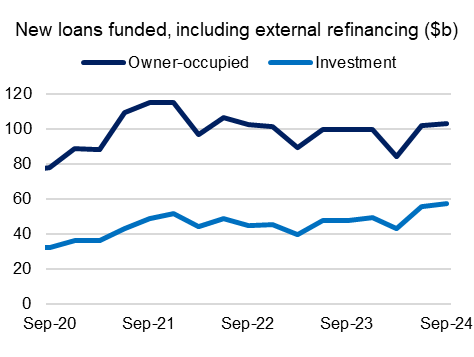
- New lending continued to grow, despite higher interest rates and affordability challenges. The value of new housing loans, including refinancing, was up 9.3 per cent in the September quarter 2024 compared with the same time last year.
- New investor lending reached a series high and was 20 per cent above the same quarter last year, reflecting both new lending and refinancing activity. New owner-occupier lending grew by 3.8 per cent compared to the same quarter last year.
Lending standards remain prudent as new lending volumes grew.
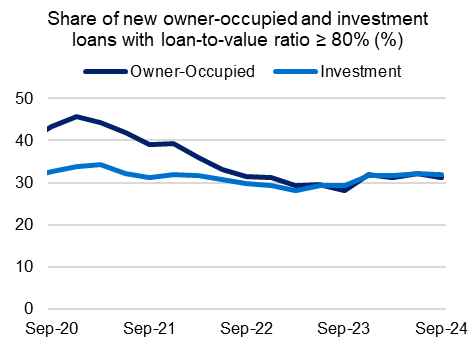
- New lending continued to grow, notwithstanding higher interest rates and affordability challenges.
ADIs’ lending standards remained prudent. The security coverage of new lending remained in line with historical trends. Loans with an LVR ≥ 80 per cent were 31 per cent of new lending.

- Likewise, the volume of highly indebted new borrowers remained low. Lending at high DTIs remained low and stable.
Interest-only lending remained near historical lows.
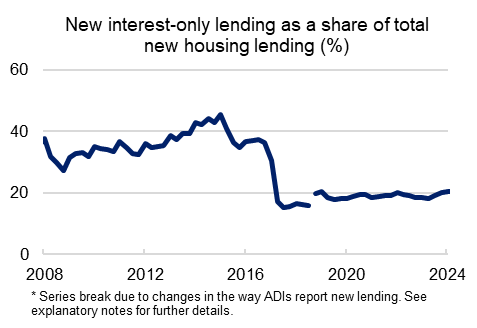
- As interest-only loans are more prevalent for investment loans, the increase in new investment lending saw an increase in new interest-only loans. Interest-only lending increased to 20.4 per cent of new lending in September 2024. This is well below historic shares.
Banks continue to provide flexibility around new lending serviceability.
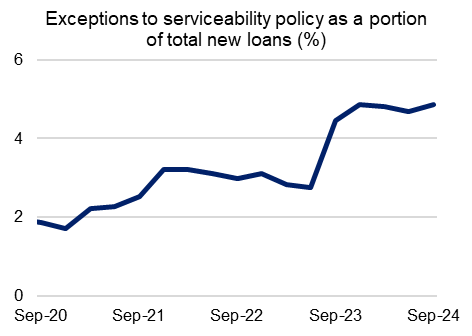
- APRA’s prudential framework allows ADIs the discretion to provide exceptions to their serviceability policies on a case-by-case basis where it is prudent to do so. This includes where ADIs reduce the serviceability buffer for borrowers facing difficulties refinancing from another lender due to increases in interest rates. APRA closely monitors these policy exceptions.1 The level of serviceability exceptions rose to a series high of 4.9 per cent of total new loans in the September quarter 2024.
Residential mortgages: asset quality
Asset quality remained sound as early-stage arrears improved.
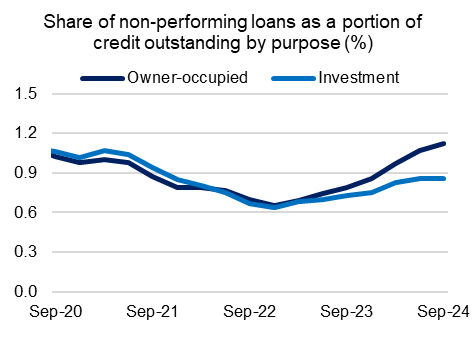
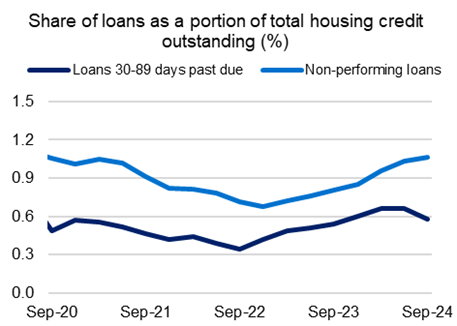
Cost of living pressures coinciding with sustained high debt servicing costs have continued to increase stress amongst a small segment of borrowers. Non-performing loans grew to 1.06 per cent of total credit outstanding. This remains low, reflecting the resilience of households in stressed borrowing conditions.
- The share of non-performing loans for owner occupiers continues to rise gradually, reaching 1.1 per cent while the share for investors was stable at 0.9 per cent.

- However, early arrears improved over the quarter. Loans in early-stage arrears (30-89 days past due) declined to 0.58 per cent of the portfolio in September 2024. While this may be partially due to seasonal factors, it is the largest quarterly decrease since September 2022. Loan quality may deteriorate further if labour market conditions weaken materially more than currently expected.
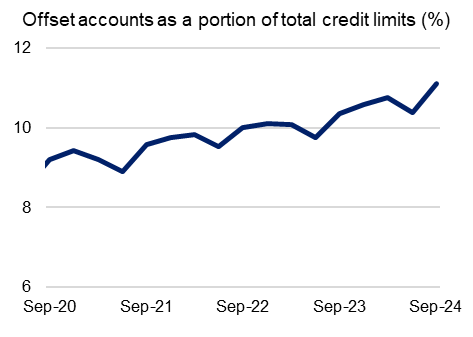
- Despite these stresses, certain segments of borrowers have continued to make excess repayments, growing offset account balances. Over the year to September 2024, the balance of offset accounts increased from 10.4 per cent of total credit limits to 11.1 per cent
Commercial real estate
Commercial real estate lending growth increased for the second consecutive quarter.
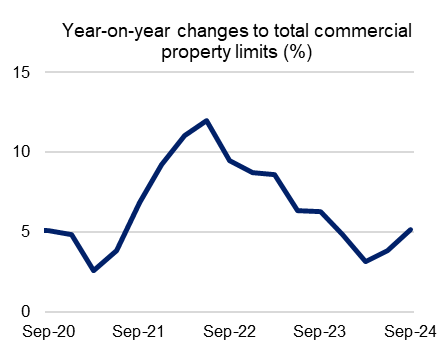
- Continued strong demand for industrial property continued to drive growth in ADIs’ commercial real estate lending. Commercial property credit limits grew 5.2 per cent in the year to September 2024. Growth in the September quarter was 2.1 per cent, the fastest growth since March 2023.
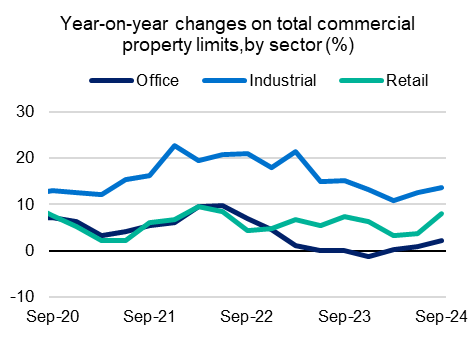
- Strong demand for warehouses drove the increase in lending for industrial property, which grew by 13.7 per cent over the year. Lending for retail properties experienced an increase of 8.0 per cent over the year.
- Lending for office properties continued its recent growth after a period of subdued activity. Office property lending grew 2.2 per cent over the year to September 2024.
Commercial real estate asset quality remained sound despite some deterioration.
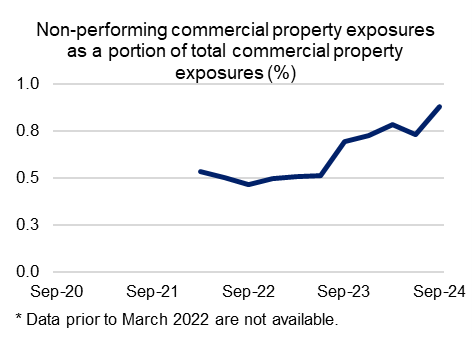
- The gradual deterioration of banks’ commercial real estate portfolios continued, with the level of non-performing exposures increasing, albeit from a low base. Non-performing commercial property exposures remain low and increased to 0.88 per cent of total commercial property exposures in September 2024.
Disclaimer and Copyright
While APRA endeavours to ensure the quality of this publication, it does not accept any responsibility for the accuracy, completeness or currency of the material included in this publication and will not be liable for any loss or damage arising out of any use of, or reliance on, this publication.
© Australian Prudential Regulation Authority (APRA) 2024
This work is licensed under the Creative Commons Attribution 4.0 Licence (CCBY 4.0). This licence allows you to copy, redistribute and adapt this work, provided you attribute the work and do not suggest that APRA endorses you or your work. To view a full copy of the terms of this licence, visit: https://creativecommons.org/licenses/by/4.0/