Quarterly authorised deposit-taking institution property exposure statistics - highlights
Key messages
- Mortgage credit growth was stable, above pre-pandemic levels.New lending grew for both owner-occupiers and investors, despite high interest rates. Even with the increased volume, new lending remained prudent, as the share of lending at high loan-to-valuation ratios (LVR) or high debt-to-income (DTI) ratios was low and stable.
- Mortgage asset quality remained sound, despite a continued gradual increase in non-performing loans. Ongoing cost of living pressures and elevated borrowing costs have led to a rise in the number of borrowers in stress, however this cohort remains a very small part of the banks’ portfolios.
- Structural factors continued to drive divergent lending experiences across commercial property sectors. Strong demand for industrial property saw an increase in ADIs’ exposures, while the shift towards remote working continued to weigh on lending for office properties. Overall growth in commercial property lending stabilised after a period of decline, and non-performing commercial property exposures remained low.
Residential mortgages: credit growth and new lending
Mortgage credit growth has stabilised at a higher level than before the pandemic.
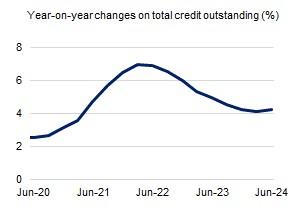
- Mortgage credit growth has stabilised above the rate observed before the pandemic. Total mortgage credit grew by 4.2 per cent over the year to June 2024. This is below the recent peak of 7.0 per cent in March 2022 when interest rates were very low, but above the pre-pandemic level of around 2.5 per cent.
- Growth in credit for owner-occupiers was higher than for investors, although the gap continued to narrow reflecting faster growth in new investor lending.
New lending increased, led by investors.
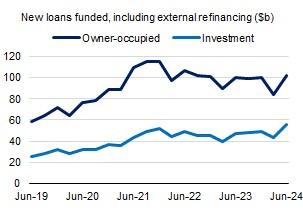
- The volume of new lending continued to grow, despite high interest rates and ongoing affordability challenges. New housing loans, including refinancing, were up 6.9 per cent in the June quarter 2024 compared with the same time last year. The increase was driven by both owner-occupied and investor loans.
- While new investment lending grew at a faster pace, owner-occupiers are still active. New lending to both investors and owner-occupiers was well above pre-pandemic levels.
Banks continued to lend prudently as volumes increased.
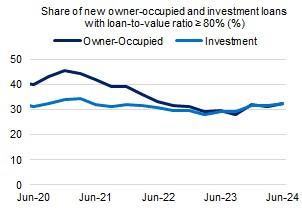
- The high level of new lending did not coincide with any observed decrease in lending standards. The portion of new loans with high LVRs or high DTIs remained low.
- High LVR lending modestly increased, driven by both owner-occupied and investment loans. The share of new loans with an LVR greater than or equal to 80 per cent increased in the June quarter 2024, to 32 per cent of new lending.
- The recent small increases in high-LVR lending were partly due to the growing take up of Commonwealth Government’s First Home Guarantee schemes, which cover up to a maximum of 15 per cent of the property value. For reporting purposes, banks recognise the borrower’s actual LVR before the application of the guarantee.
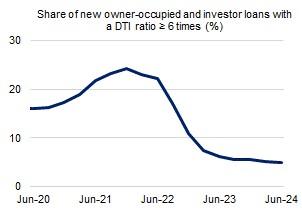
- Elevated interest rates continued to constrain capacity for high-DTI lending. The share of new loans with a DTI ratio of six or greater reached a new low of 5.0 per cent in the June 2024 quarter.
Interest-only lending remains near historical lows.
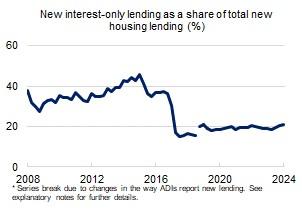
- As interest-only loans are more prevalent for investment loans, the increase in new investment lending saw an increase in new interest-only loans. Interest-only lending increased to 21.0 per cent of new lending in June 2024. This is well below historic levels.
Banks continued to adopt a flexible approach in assessing serviceability.
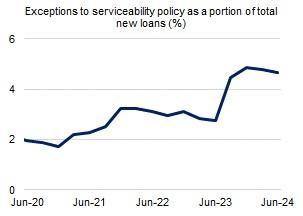
- APRA’s prudential framework allows ADIs to provide exceptions to their serviceability policies where it is prudent to do so. This includes where borrowers face difficulties refinancing with another lender due to increases in interest rates. APRA closely monitors these policy exceptions.1
- The level of exceptions stood at 4.7 per cent of total new loans in the June quarter 2024, down marginally from the December 2023 peak of 4.9 per cent.
Residential mortgages: asset quality
Overall asset quality remained sound despite a further increase in non-performing loans.
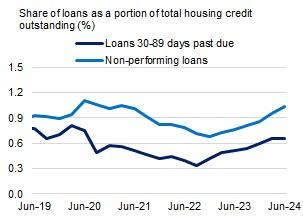
- Higher interest rates and broader cost of living pressures are weighing on a small portion of borrowers’ ability to make their required loan repayments. The share of non-performing loans as a result recorded its sixth consecutive quarterly increase in the June quarter 2024. Despite this, the share of non-performing loans remained low at around 1 per cent. The share of loans in early-stage arrears, 30-89 days past due, was stable at 0.7 per cent.
- Growing housing prices improved the overall security coverage of these loans, limiting the potential loss given default. Only 0.1 per cent of loans are both non-performing and with an LVR greater than or equal to 95.
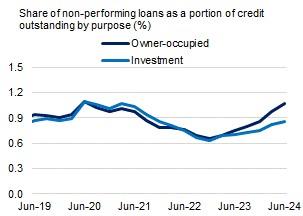
- The share of non-performing loans stood at 1.1 per cent for owner occupiers and 0.9 per cent for investors.
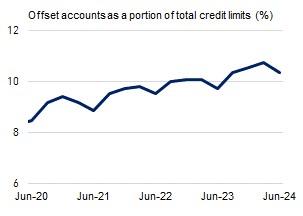
- Other borrowers have continued to make excess repayments, with the trend of growing offset account balances continuing (with the usual seasonal decline in June). Over the year to June 2024, the balance of offset accounts increased from 9.7 per cent of total credit limits to 10.4 per cent.
Commercial real estate
Commercial real estate lending remained subdued, but was no longer decelerating.
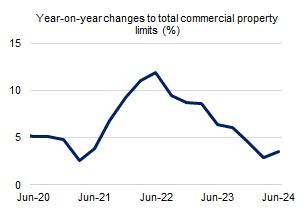
- Growth in commercial real estate lending increased for the first time in two years, driven by industrial and retail sectors. However, growth remained subdued compared to historical averages. Total commercial property exposure limits grew by 3.6 per cent in the year to June 2024.
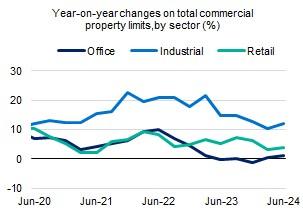
- Strong demand for industrial warehouses saw lending growth hold up for this asset class. ADIs’ industrial real estate exposure limits grew by 12.1 per cent over the year to June 2024.
- In contrast, office properties continued to be impacted by structural factors including a shift towards remote working. Growth in exposure limits remained modest at 1.1 per cent over the year to June 2024. Retail property exposure limits remained broadly unchanged in the June quarter 2024 and was 3.7 per cent higher than a year ago.
Asset quality of domestic commercial property remained sound.
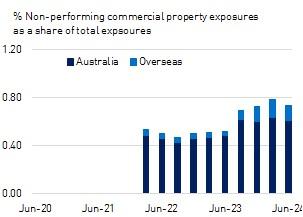
- Asset quality remained stable, despite subdued conditions particularly across office properties. After rising for six consecutive quarters, the share of total commercial property exposures that are non-performing fell marginally over the June 2024 quarter, down from 0.78 per cent to 0.73 per cent.
- This decline was mainly driven by overseas exposures, while non-performing exposures were relatively flat across domestic assets. Overseas assets account for around 10 per cent of ADIs’ total commercial property exposures.
Footnotes
1Letter to all ADIs: Housing lending standards: Reinforcing guidance on exceptions