Quarterly authorised deposit-taking institution property exposure statistics - highlights
Key messages
- Mortgage credit growth has remained stable, despite higher interest rates and increasing pressure on ADIs’ lending margins. New owner-occupied lending was more subdued than investor lending. New lending remained prudent, as indicated by debt-to-income (DTI) ratios and loan-to-valuation ratios (LVR).
- Non-performing housing loans increased but asset quality remained sound. There was evidence that the majority of borrowers were resilient in adapting to ongoing cost-of-living pressures, as reflected in increasing offset balances. However, the number of borrowers in stress is increasing, although this pocket remained small.
- Commercial real estate lending continued to slow. The slowdown was prominent in the office sector, whilst lending within the industrial sector remained strong. Non-performing commercial property exposures increased but remained at low levels overall.
Residential mortgages: credit growth and new lending
Mortgage credit growth was stable.
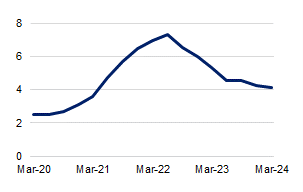
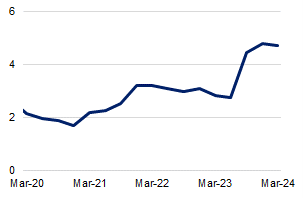
- While mortgage credit growth has moderated from the peak in 2022, it has stabilised above pre-pandemic levels.
- Total mortgage credit grew by 4.1 per cent over the year to March 2024. This is below the peak of 7.3 per cent, but above the pre-pandemic level of 2.5 per cent in the year to March 2020.
- The overall growth in credit for owner-occupiers remained higher than for investors, at 4.9 and 3.8 per cent respectively.
New owner-occupier lending was more subdued while investor lending was unchanged.
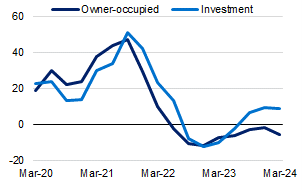
- A decline in external refinancing activity contributed to a slowdown in new owner-occupier lending. New owner-occupied lending was 5.8 per cent lower in March 2024 compared to March 2023. New investor lending was 8.5 per cent higher over the same period.
- Investors’ share of new housing loans increased marginally over the March 2024 quarter. However, this remained well below the historical peak in 2015.
- There has been a narrowing of the spread between interest rates charged for new investor lending above new owner-occupier lending, suggesting that ADIs may be seeking to increase lending to investors.1This pricing shift could be contributing to the growth in new investor loans.
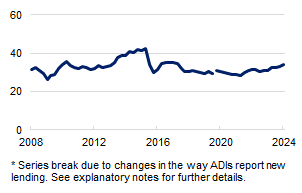
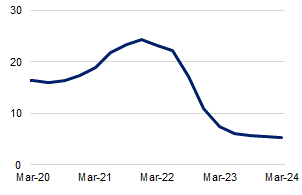
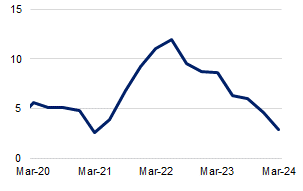
The level of external refinancing returned to historical averages.
- The level of external refinancing activity stabilised over the quarter. This followed a significant decline from record highs, after lenders withdrew cashback offers in late 2023. The share of new loans that are external refinancing in the March 2024 quarter was in line with the long-term trend, at 35 per cent of new lending.
Lenders continued to allow flexibility in assessing refinancing.
- APRA’s prudential framework allows ADIs to provide exceptions to their serviceability policies where it is prudent to do so. This includes where borrowers face difficulties refinancing with another lender due to increases in interest rates. APRA closely monitors these policy exceptions.2
Exceptions to serviceability policies increased last year when external refinancing volumes were at their peak. As expected, the level of exceptions stabilised in March 2024, at 4.7 per cent of new loans.
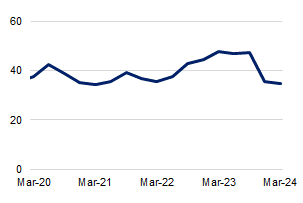
New lending remained prudent and well secured.
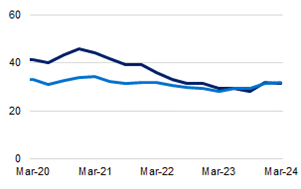
- ADIs continued to apply prudent lending standards. New lending at high LVRs or DTI ratios remained near historical lows.
- The share of new loans with an LVR greater than 80 per cent was 31 per cent during the March 2024 quarter. This remained well below long term trends.
- Higher interest rates continued to constrain borrowing capacity. The share of new loans with a DTI ratio of six or greater reached a new low of 5.2 per cent in the March 2024 quarter.
Residential mortgages: asset quality
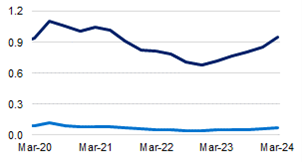
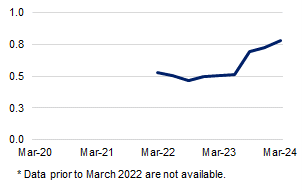
Overall asset quality remained sound despite a continued increase in non-performing loans.
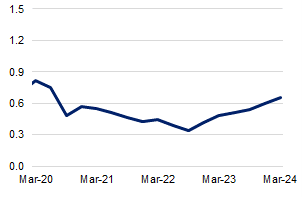
- Borrowers remained resilient despite continuing pressure from higher interest rates and increases in the cost-of-living. There is, however, a small but growing pocket of borrowers in stress.
- The share of total loans that are 30-89 days past due increased to 0.66 per cent during the March 2024 quarter. This follows a steady increase from a low of 0.34 per cent in mid-2022. The share of loans that are non-performing increased to 0.95 per cent of total loans. These increases are from very low levels, with overall asset quality remaining sound.
- Only a very small percentage of non-performing loans had very high LVRs. Growing housing prices is likely to have improved the overall security coverage of these loans.
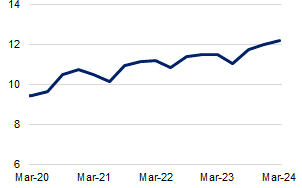
- Many borrowers also continued to make excess repayments to their loans. The balance of offset accounts increased to 12 per cent of total credit outstanding, the highest recorded in the series.
Commercial real estate
Growth in commercial real estate lending continued to slow.
Commercial real estate lending continued to grow, but at a slowing pace. Total commercial real estate exposure limits grew by 2.9 per cent in the year to March 2024, the weakest growth rate since March 2021.
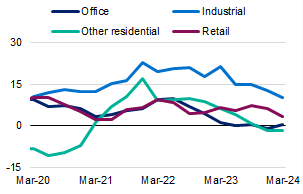
Continued weakness in the office market saw ADIs’ exposure limits in this sector increase by just 0.5 per cent over the year to March 2024. Exposure limits to other residential property, which includes residential development, declined by 1.6 per cent over the year.
- Industrial real estate remains the fastest growing sector, with exposure limits growing by 10.3 per cent over the year to March 2024.
The asset quality for commercial real estate lending remained sound despite several quarters of deterioration.
- Non-performing commercial real estate exposures continued to increase, but remained low. The share of total commercial property exposures that are non-performing increased marginally over the March 2024 quarter to 0.78 per cent. This increase is in part driven by weaker overseas exposures.
Footnotes
1 See RBA Statistical Table F6 Housing Lending Rates
2 Letter to all ADIs: Housing lending standards: Reinforcing guidance on exceptions