Quarterly authorised deposit-taking institution property exposure statistics – highlights
Key statistics 1
APRA's Quarterly Publication Highlights for ADIs have been updated as of December 2024. This quarter's publication, along with future editions, will consist of charts and summary tables without written commentary or insights. This change will bring about consistency for APRA's quarterly publication highlights across all APRA-regulated industries.
| Key statistics | |||
|---|---|---|---|
Dec 2023 | Dec 2024 | Year-on-year change | |
ADIs' residential property exposures | |||
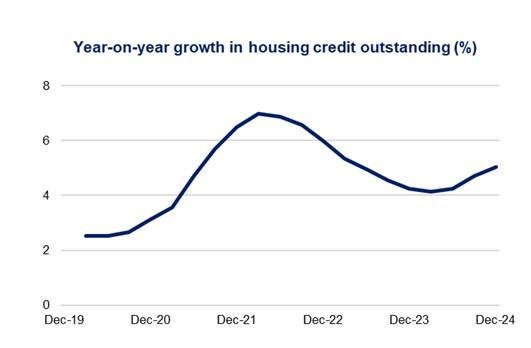
| Total credit outstanding ($bn) | 2,210.5 | 2,322.2 | 5.1% |
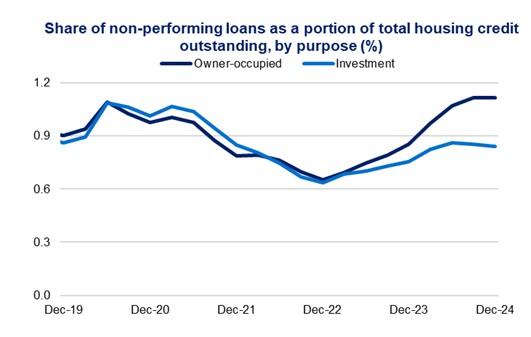
| Owner-occupied loans - share | 67.7% | 67.7% | -0.06 points |
| Investment loans - share | 30.3% | 30.4% | 0.05 points |
| Loans with loan-to-valuation ratio (LVR) ≥ 80 per cent - share | 18.0% | 17.4% | -0.67 points |
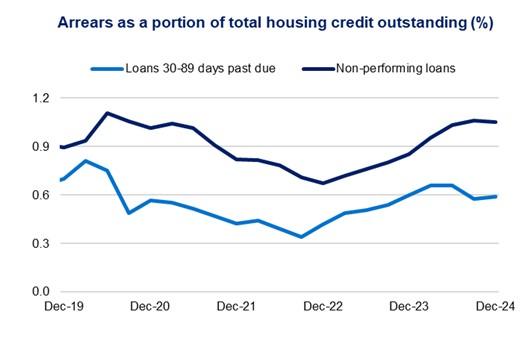
| Loans 30-89 days past due - share | 0.60% | 0.59% | -0.01 points |
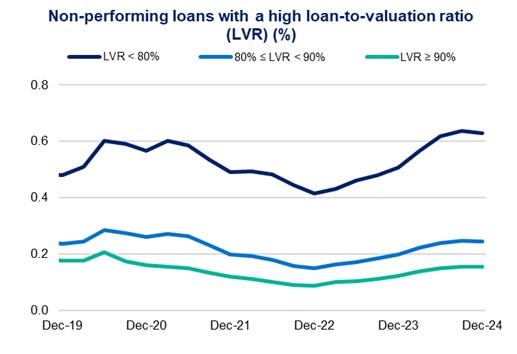
| Non-performing loans - share | 0.85% | 1.05% | 0.2 points |
ADIs' new loans funded during the quarter |
| ||
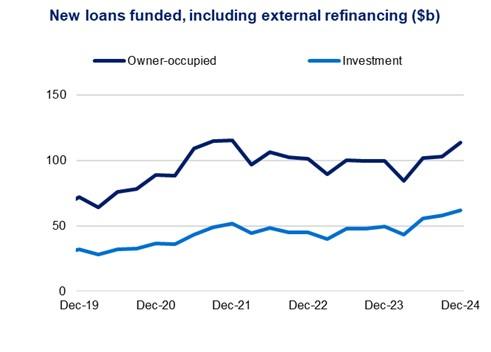
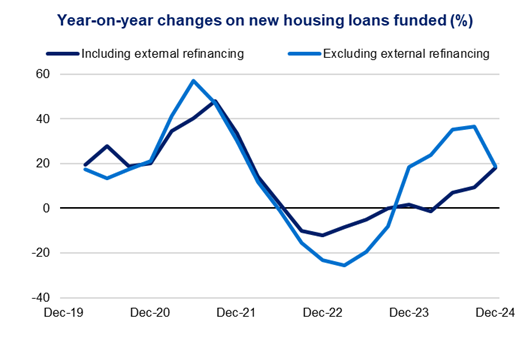
| New loans funded ($bn) | 152.5 | 179.9 | 18.0% |
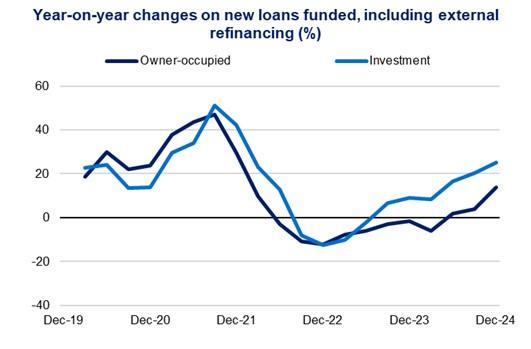
| New owner-occupied loans funded - share | 65.6% | 63.4% | -2.23 points |
| New investment loans funded - share | 32.5% | 34.4% | 1.98 points |
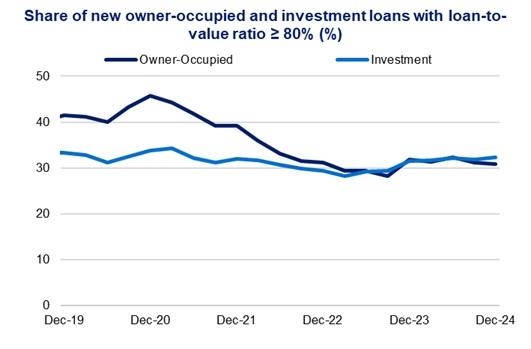
| New loans with LVR ≥ 80 per cent funded - share | 31.5% | 31.0% | -0.41 points |
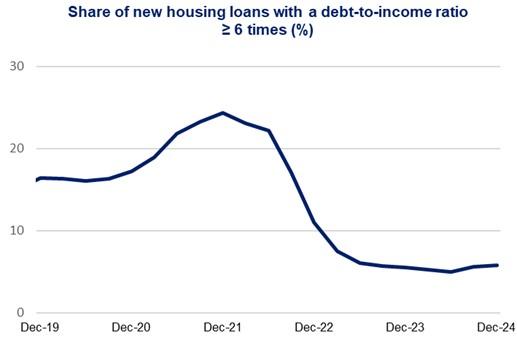
| New loans with debt-to-income (DTI) ratio ≥ 6x funded - share | 5.6% | 5.8% | 0.21 points |
ADIs' commercial property exposures |
| ||
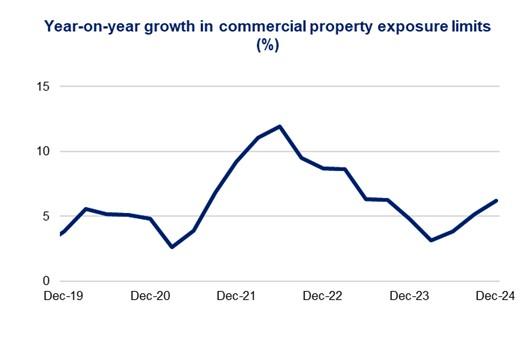
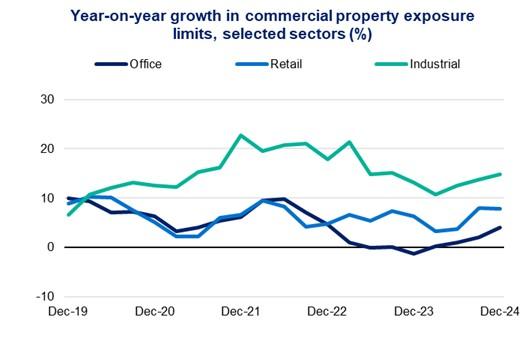
| Commercial property exposure limits ($bn) | 446.9 | 474.6 | 6.2% |
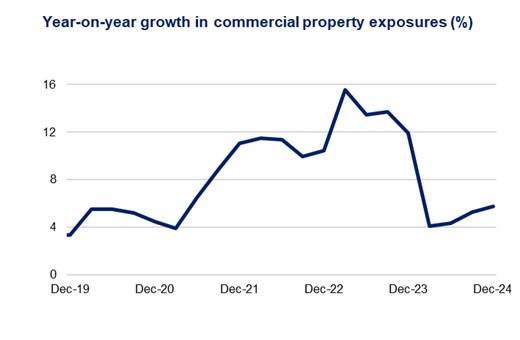
| Commercial property exposures ($bn) | 415.7 | 439.6 | 5.7% |
Residential mortgages: new lending
 |  |
 |  |
 |  |
 |  |
Residential mortgages: outstanding credit
 |  |
 |  |
 |
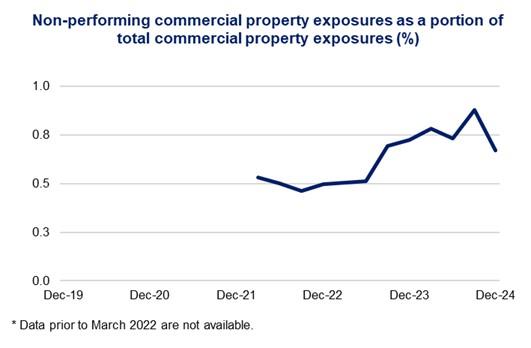
Commercial real estate
 |  |
 |  |
Footnote
1 Excludes ADIs that are not banks, building societies or credit unions. See ‘Explanatory Notes’ of the Quarterly authorised deposit-taking institution property exposures statistics (excel file) for details of share calculations.