Quarterly authorised deposit-taking institution performance statistics - highlights
Key Statistics 1
APRA's Quarterly Publication Highlights for ADIs have been updated as of December 2024. This quarter's publication, along with future editions, will consist of charts and summary tables without written commentary or insights. This change will bring about consistency for APRA's quarterly publication highlights across all APRA-regulated industries.
Dec 2023 | Dec 2024 | Year-on-year change | |
|---|---|---|---|
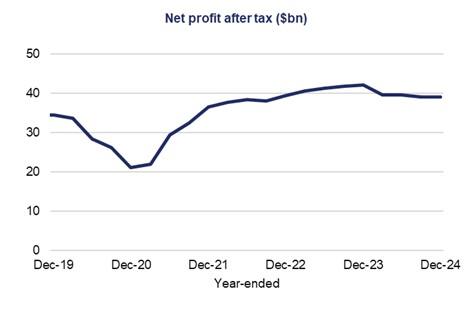
| Net profit after tax (year-end) ($bn) | 39.5 | 39.6 | 0.4% |
| Total assets ($bn) | 6,259.7 | 6,621.5 | 5.8% |
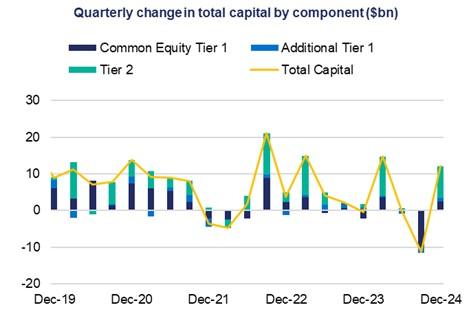
| Total capital base ($bn) | 434.2 | 449.6 | 3.6% |
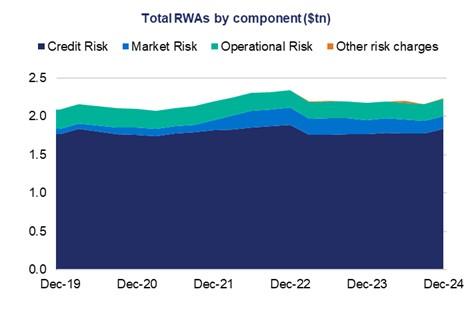
| Total risk-weighted assets ($bn) | 2,176.5 | 2,238.0 | 2.8% |
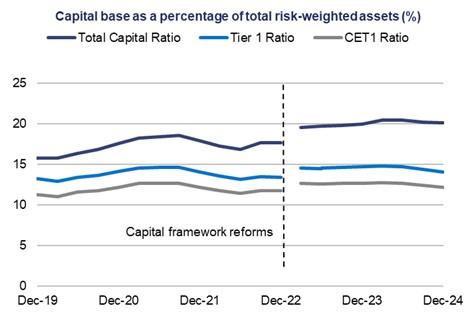
| Total capital ratio | 20.0% | 20.1% | 0.1 points |
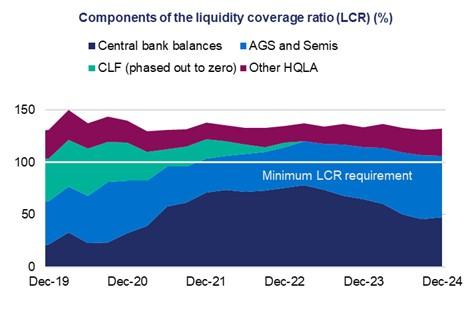
| Liquidity coverage ratio | 133.7% | 132.2% | -1.5 points |
| Minimum liquidity holdings ratio | 17.7% | 17.4% | -0.3 points |
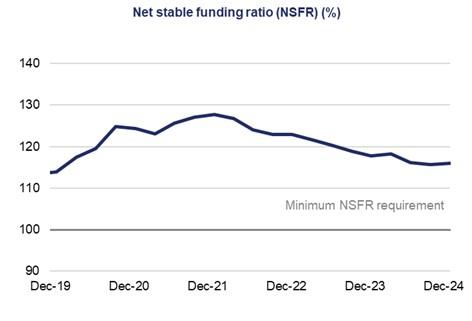
| Net stable funding ratio | 117.8% | 116.0% | -1.7 points |
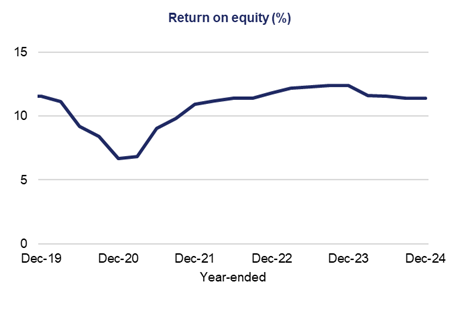
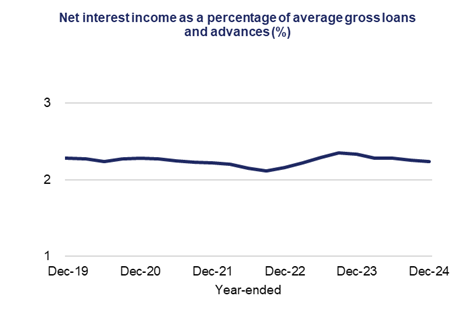
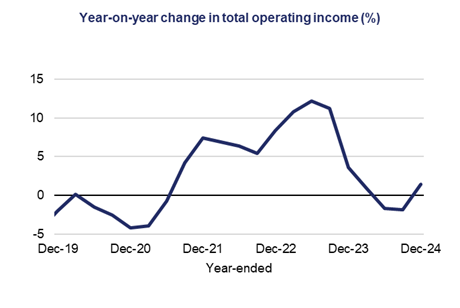
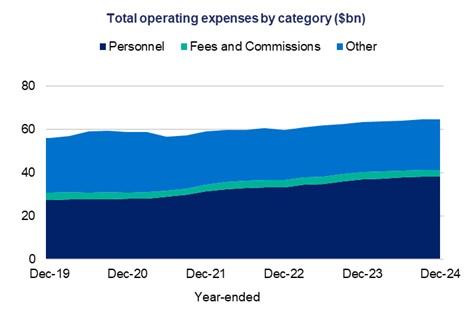
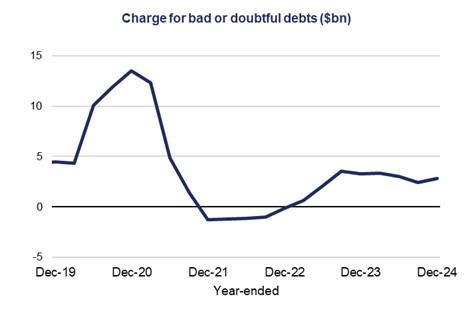
Financial performance
 |  |
 |  |
 |  |
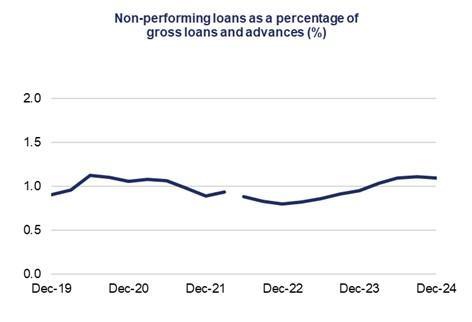
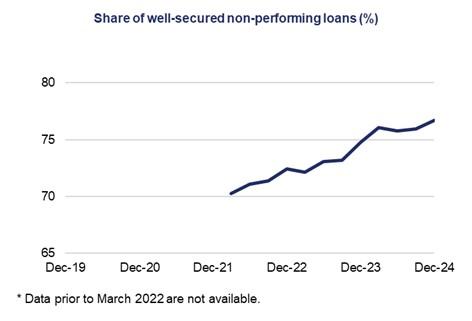
Asset quality
 |  |
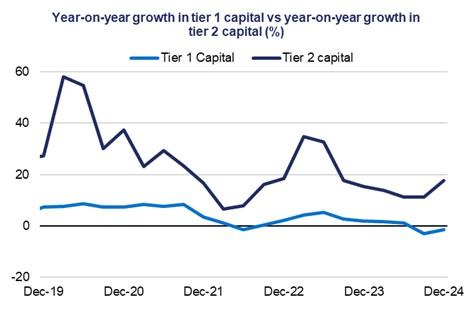
Capital adequacy
 |  |
 |  |
Liquidity
 |  |
 |
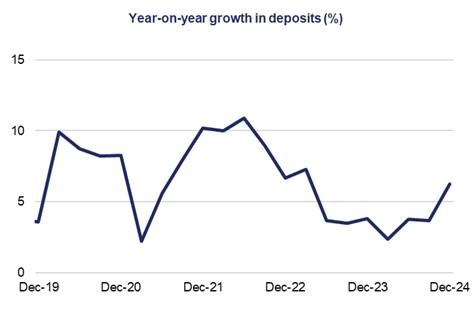
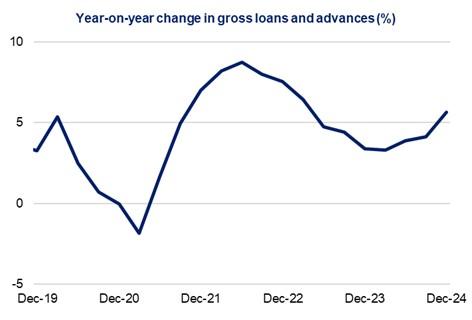
Financial position
 |  |
Footnote
1 Excludes ADIs that are not banks, building societies or credit unions, such as payment providers.