Quarterly authorised deposit-taking institution performance statistics - highlights
Key messages
- Bank profitability remained steady for the fourth straight quarter. Headwinds came from competition keeping margins narrow and rising operating costs. Tailwinds continued from low credit losses and above-average credit growth.
- Overall asset quality remained sound as borrowers continued to show resilience. Despite the small but gradual increase in non-performing loans over the past year, most borrowers have strong equity positions which limits potential losses for banks.
- Capital levels remained well above the unquestionably strong benchmarks. Capital ratios declined slightly over the quarter, as banks continued to return capital to shareholders. The major banks declared an average dividend per share that was 1.8 per cent higher in the 2024 financial year compared with the prior year. Various share buybacks are ongoing.
- Liquidity levels remained strong with both the liquidity coverage ratio (LCR) and net stable funding requirement (NSFR) ratio well above regulatory minimums.
Financial performance
Competition continued to compress banks’ margins from elevated levels.
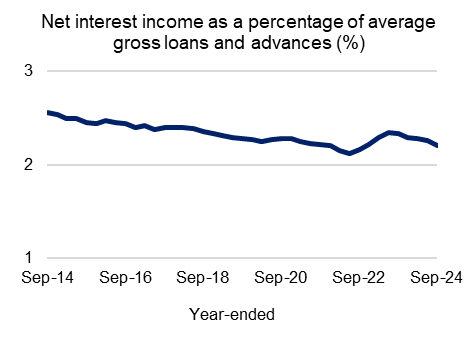
- ADIs continued to offer competitive pricing which placed pressure on margins. As a percentage of gross loans and advances, net interest income declined marginally by 2 basis points to 2.2 per cent.
Growth in operating income remained negative but appears to have stabilised.
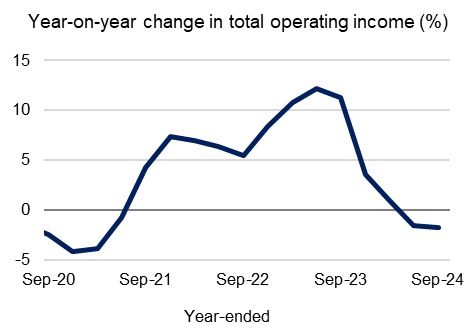
The benefits to banks associated with a rising cash-rate have expired. Annual income growth peaked in June 2023 at 12.1 per cent, and banks have now reported a second quarter of negative income growth.
Other operating income remained flat for the quarter. Total operating income declined over the year to September 2024 by 1.8 per cent.
Wages have been the key driver of expense growth since 2020.
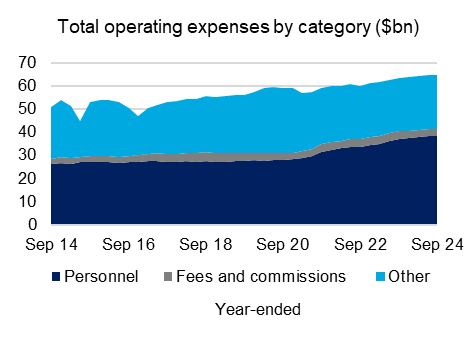
- Total operating expenses grew to $64.8 billion, which is a record high. Personnel expenses have increased 36 per cent since September 2020, and now represent the largest category of expenses. Some ADIs are continuing to work through redundancies, which contributed to a slight easing in expense growth over the quarter.
Credit losses have been limited by strong equity positions and low unemployment.
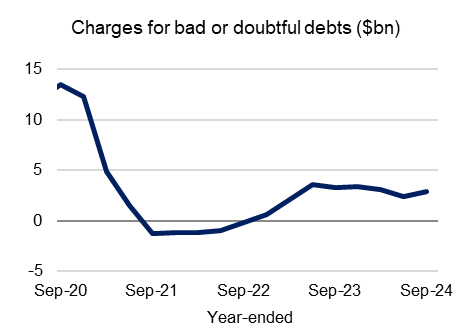
- Bank profits continued to be supported by very low levels of credit losses. High asset prices, particularly in housing, provide banks with better and more collateral. The charge for bad and doubtful debts for the year ended September 2024 was $2.8 billion.
Profit increased marginally and return on equity remained solid.
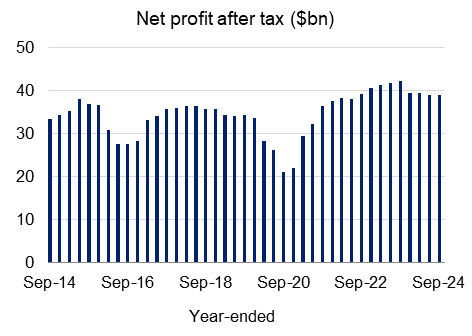
- Net profit after tax (NPAT) was $39.0 billion for the year to September 2024. This was a marginal increase of $69 million compared to the year ended June 2024. Return on equity (ROE) declined marginally to 10.0 per cent, broadly in line with levels seen over the past decade.
Asset quality
Borrowers remained resilient and able to service their debts.
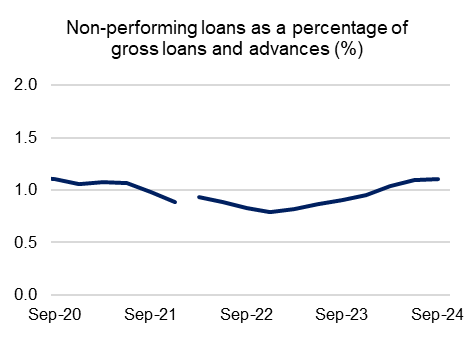
- Asset quality in both housing and business lending remained sound. The stage three tax cuts and a strong labour market have helped housing borrowers withstand the economic pressures of inflation and elevated interest rates. In some sectors, business insolvencies have increased from low levels, though the flow-through to non-performing loans (NPLs) remains low. NPLs, as a share of total loans, increased marginally from 1.09 in June 2024 to 1.11 per cent in September 2024.
Robust collateral positions helped keep bank lending secure.
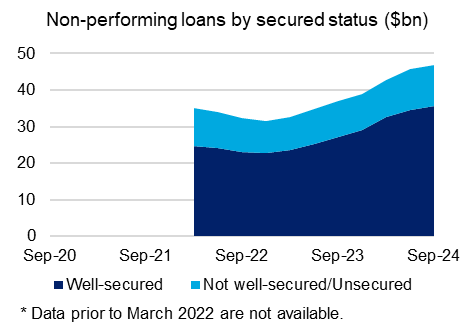
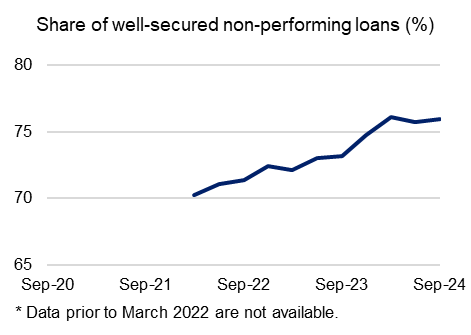
- Bank balance sheets remain well-protected. The share of NPLs that are well-secured increased by 17 basis points to 75.9 per cent in September 2024. This high level of security, supported by rising asset prices, limits potential losses for banks.
Capital
Bank profits continued to support capital buffers.
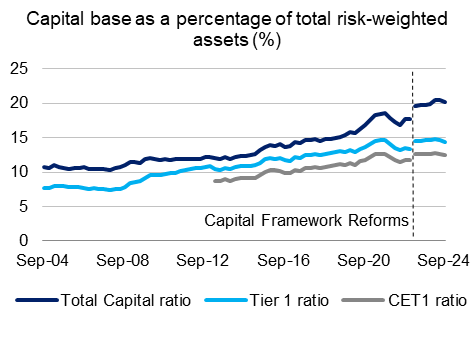
- The Common Equity Tier 1 (CET1) and Tier 1 ratios were 12.4 per cent and 14.4 per cent, respectively.
A small increase in Tier 2 capital was offset by a $9.8 billion decline in CET1. This was largely driven by the major banks, which continued to pay dividends and complete share buybacks.

- There was a minor reduction in Additional Tier 1 Capital (AT1) in the September 2024 quarter. APRA has recently sought feedback on a proposal to replace outstanding AT1 instruments with more reliable and effective forms of regulatory capital.
Risk-weighted assets were steady, with a decrease in IRRBB offsetting an increase in credit.
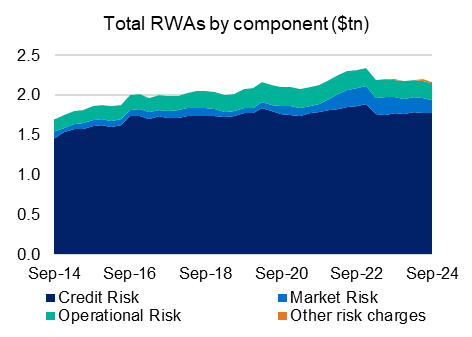
- Market risk risk-weighted assets (RWAs) associated with Interest-Rate Risk in the Banking Book (IRRBB) declined by 16 per cent. Banks are experiencing embedded gains as maturing swaps that were loss making are rolling-off.
- These declines were partially offset by increases in credit risk RWAs. Total RWAs declined slightly by 2 per cent.
Liquidity
Liquidity coverage ratios remained steady and above regulatory minimums.
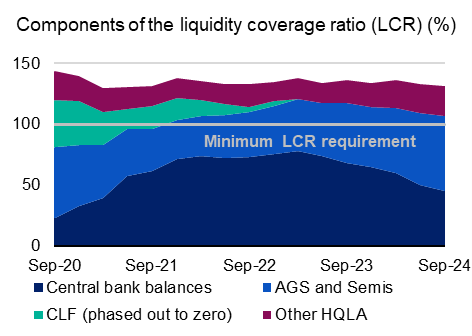
- Bank liquidity positions remained strong in the absence of the Term Funding Facility (TFF). Central bank balances continued to decline and now represent around 35 per cent of high-quality liquid assets (HQLA). Australian Government securities (AGS) and Semi-Government securities (Semis) now make up the largest portion of HQLA at around 47 per cent in September 2024.
- The industry LCR remained well above the regulatory minimum of 100 per cent, with a marginal decline of 1.7 percentage points to 131.2 in the September quarter.
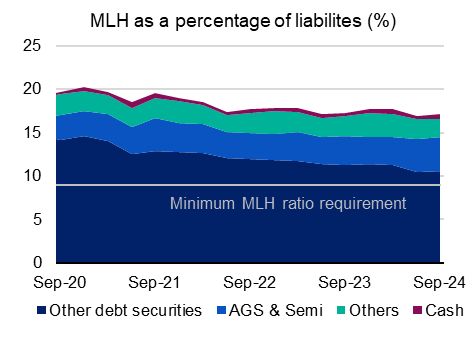
- The minimum liquidity holding (MLH) ratio, which is applicable to smaller, less complex ADIs, increased from 16.9 per cent to 17.1 per cent over the quarter. This is well above the regulatory minimum of 9 per cent.
The industry’s stable funding base declined slightly, nearing pre-COVID levels.
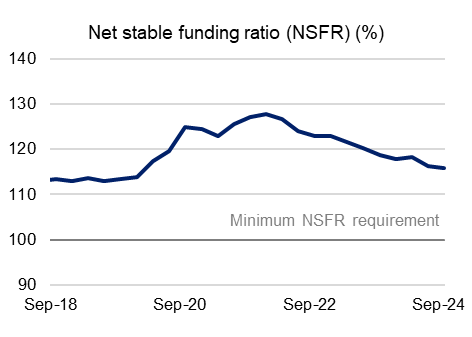
The industry’s aggregate net stable funding ratio (NSFR) declined slightly to 115.7 per cent, remaining well above the minimum NSFR requirement of 100 per cent. The NSFR has been returning to the long-term average as pandemic measures continue to wind down.
Population changes
The number of ADIs on a consolidated group basis operating in Australia declined from 135 to 133 over the quarter:
- International Bank of Australia Pty Limited, a restricted ADI, had its licence revoked, ceasing to be an APRA regulated ADI as at 30 September 2024.
- Suncorp-Metway Limited was acquired by ANZ Group Holdings Limited, effective 1 August 2024. While Suncorp will continue to hold its own ADI licence (under the name Norfina Limited), its financial positions are consolidated into ANZ in these quarterly statistics.
Disclaimer and Copyright
While APRA endeavours to ensure the quality of this publication, it does not accept any responsibility for the accuracy, completeness or currency of the material included in this publication and will not be liable for any loss or damage arising out of any use of, or reliance on, this publication.
© Australian Prudential Regulation Authority (APRA) 2024
This work is licensed under the Creative Commons Attribution 4.0 Licence (CCBY 4.0). This licence allows you to copy, redistribute and adapt this work, provided you attribute the work and do not suggest that APRA endorses you or your work. To view a full copy of the terms of this licence, visit: https://creativecommons.org/licenses/by/4.0/