Insights Paper - Comprehensive Product Performance Package
Foreword
The release of the Comprehensive Product Performance Package (CPPP) is the next step in APRA’s work to sharpen trustees’ focus on improving member outcomes by bringing together performance metrics of the performance test and the former heatmaps. Doing so provides trustees the ability to understand the performance of their products relative to the industry through a comprehensive set of performance metrics. The CPPP also provides the broader community with more transparency around product performance and how trustees are delivering appropriate retirement outcomes for their members.
Through the introduction of APRA’s MySuper heatmap in 2019 and the legislated Performance Test (PT) in 2021, we have seen a significant uplift in outcomes being delivered to members across the entire superannuation industry. This uplift is welcome, however, there are still products that are underperforming that need to be improved – particularly among choice product offerings.
Product performance is a key element that trustees must consider when managing the retirement savings of their members. Trustees must act in their members’ best financial interests in both the design and provision of products and services to members. Prudential Standard SPS 515 Strategic Planning and Member Outcomes (‘SPS 515’) requires trustees to embed a comprehensive approach for assessing the delivery of member outcomes and improve these outcomes when targets are not met. APRA has no tolerance for members to remain in poorly performing products without credible and timely action by a trustee to rectify poor performance.
APRA expects trustees to embed the comprehensive insights offered by the CPPP into the actions taken under SPS 515. APRA will continue to review outcomes assessments and business performance reviews to ensure trustees embed the CPPP’s insights into their review of business operations. Supervisory attention will be directed where trustee practices do not meet APRA’s expectations. APRA’s supervisory intensity is heightened where there is widespread poor performance across a trustee’s product offering, as this may be indicative of weaknesses in governance arrangements and business operations.
Margaret Cole
Deputy Chair
Dashboard
View an accessible version of this dashboard.
1. Introduction
The CPPP brings together the performance metrics of the PT and those contained in the former heatmap publications, to provide trustees, superannuation fund members and the broader community with a clear understanding of how products are performing across the entire superannuation industry. In doing so, trustees can see how their products are performing directly and comparatively to ensure they remain in their members’ best financial interests.
The CPPP includes:
- this insights paper that provides detailed analysis on the components of the legislated performance test, investment returns, and fees and costs;
- statistical publications that include the underpinning data for the CPPP in excel and csv formats;
- an interactive online tool that can be accessed (via the APRA website) by trustees, members and the broader community to easily look up and compare the performance of products; and
- a methodology paper that provides a technical understanding of the CPPP population and metrics.
The CPPP is APRA’s next step in its work on improving transparency, particularly in relation to product performance and ensuing trustees are focusing on delivering appropriate outcomes for their members.
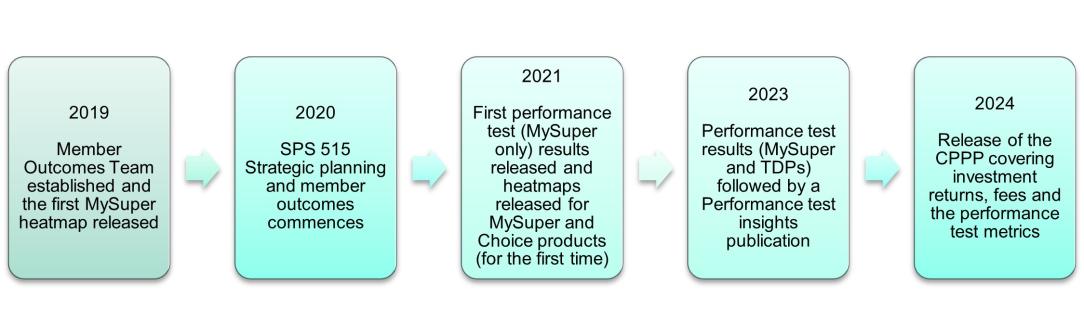
Product Performance Transparency Milestones: 2019 – Current
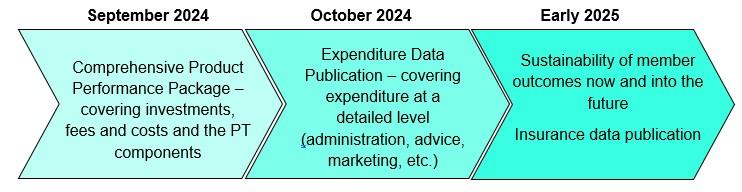
The release of the CPPP is the first in a series of releases APRA will make over the remainder of 2024 and in the first half of 2025, aimed at increasing transparency on other aspects of trustee decision making which impact the outcomes being delivered to their members and the broader community.
Upcoming Transparency Releases
Key Terms
Product Types:
- Single Strategy MySuper Products: Default products that have a single diversified investment strategy (one underpinning investment option) that comply with legislated requirements around fees and the provision of member benefits.
- Lifecycle MySuper Products: MySuper Products with an investment strategy that comprises several different identifiable asset allocations that adjust members’ exposure to investment risk as they age (known as lifecycle stages).
- Choice Products: Investment offerings that enable members to be more actively involved with how their superannuation savings are invested. There is a wide range of choice products with different investment strategies and risk profiles.
How are the products managed?
- Trustee Directed Products (TDPs): Diversified investment offerings where the trustee or a connected entity of the trustee has control over the management of investments and/or sets the strategic asset allocations of the product offering.
- Externally Directed Products (EDPs): Diversified investment offerings where the trustee or a connected entity of the trustee has no control over the management of investments and does not set the strategic asset allocation of the product offering.
How are the products accessed?
- Platform products: Investment offering structures that allow members to create bespoke portfolios by investing in a wide range of options. In most cases, this occurs through the assistance of a financial adviser.
- Non-platform products: Standalone investment offerings that have varying risk profiles or growth/defensive allocations (e.g. high growth, growth, balanced, conservative, etc.) where members may choose options that better reflect their risk appetite.
- Investment pathway: The unique combination of superannuation product, investment menu and investment option, used to identify how members access investment options.
Components
The CPPP provides comprehensive transparency and insights on the components of the PT, investment returns, and fees and costs.
Performance Test
The PT is designed to protect Australians’ retirement savings from underperforming products by holding trustees accountable for the outcomes they deliver through increased transparency and significant consequences for continued underperformance. The PT has been in place since 2021 for MySuper products and since 2023 for TDPs.
The PT comprises two components:
- an investment performance component measures the implementation of an investment product’s strategy by comparing the performance of the product to a benchmark derived from the product’s Strategic Asset Allocations (SAA); and
- a fee component measures how the administration fees and costs of a product compares to peer products through a comparison fee benchmark. This benchmark is termed the Benchmark Representative Administration Fees and Expenses (BRAFE) and is the median fee and cost value for the relevant product type.
A product fails the PT if its assessment value (the combination of the two components) is below a threshold of minus 0.50 percentage points per annum.
The PT has several legislated consequences for failure. Members in a product that fails the PT must be informed of this fact in writing, while products that fail the test for two consecutive years must be closed to new members.
Broader Investment Performance Metrics
APRA also looks at other metrics to assess broader aspects of investment management activity, such as how investment strategies are set and how well they are executed.
The broader metrics include:
- Performance relative to a Simple Reference Portfolio (SRP), to measure the value-add of asset class decisions against a simple, low-cost portfolio; and
- Performance relative to peers based on underlying growth asset allocations, to compare the performance of products to similar products on a risk-adjusted basis.
To help track changes in the performance of products over time and through different market environments, the CPPP metrics are provided over different time horizons of 3, 5, 7 and 10 years.
Additional fee and costs metrics
The CPPP includes total fee and costs in addition to administration fees and costs, with both shown at the different member balances of $10,000, $25,000, $50,000, $100,000 and $250,000.
Product Coverage
The APRA-regulated superannuation industry has grown significantly in recent years and has over $2.7 trillion in member benefits as of 30 June 2024. MySuper and accumulation choice products hold $1.8 trillion of member assets.
Transparency around the performance of products across the superannuation industry has significantly increased since APRA introduced the MySuper heatmap in 2019. This year with the introduction of the CPPP, the assessment of the performance of accumulation phase products has increased to covering over 83 per cent of these assets, an increase of 54 per cent from 2019.
The CPPP has been designed to assess product offerings in the accumulation phase. Products in scope of the CPPP are:
- MySuper;
- Non-platform TDPs;
- Platform TDPs; and,
- Non-platform EDPs.
Collectively these products represent most types of investment offerings for accumulation members. The CPPP includes investment pathways that are open to new members as well as those that are closed to new members (but have existing members).
The CPPP does not include single sector products, products in the retirement phase or defined benefit products (since investment returns do not directly impact or fully account for the return outcomes experienced by members).
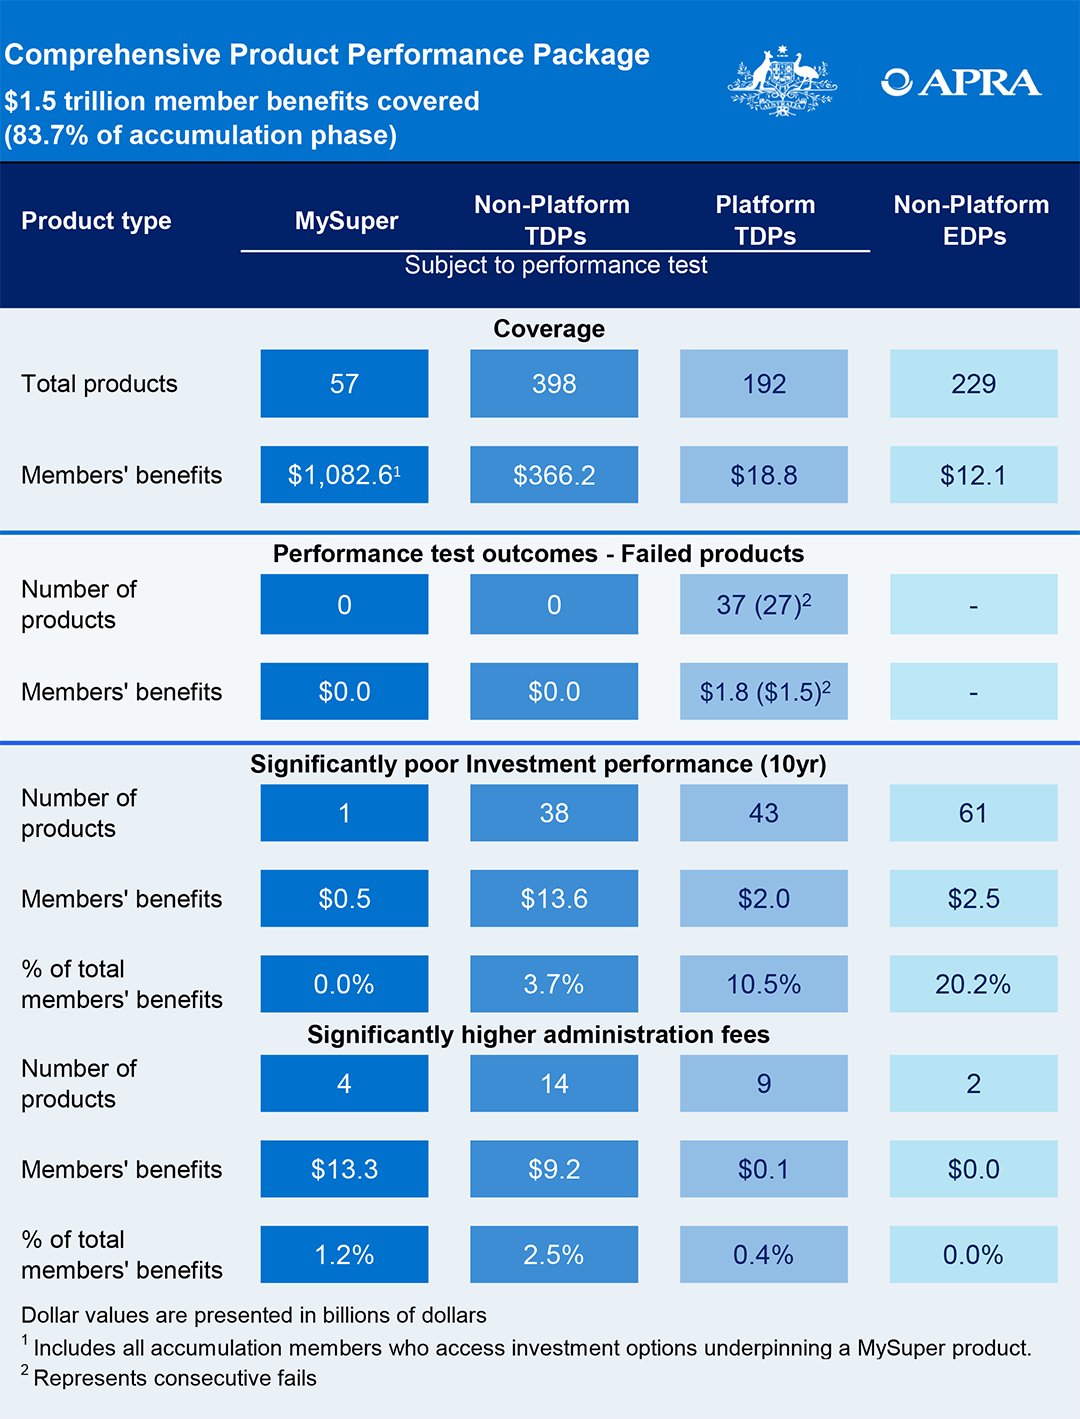
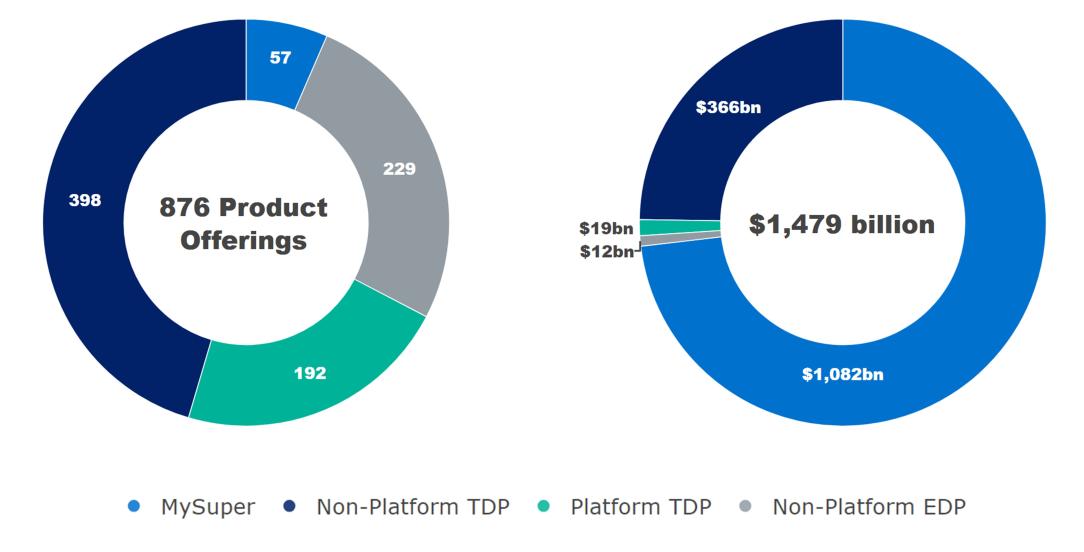
In 2024, the CPPP covers 876 product offerings with member assets of $1.5 trillion. While MySuper product offerings only represent 6.5 per cent of all products covered, they hold member assets in excess of $1.0 trillion. Non-platform TDP offerings have the second highest value of member assets of $366 billion across 398 product offerings. Non-platform EDPs and platform TDPs hold $12.1 billion and $18.8 billion in member assets and 229 and 192 in product offerings, respectively (Figure 1).
Figure 1: 2024 CPPP product type breakdown
Open investment pathways comprise around 70 per cent of the choice investment pathways in the CPPP. Closed investment pathways account for the remaining 30 per cent and tend to have lower levels of member benefits, although they still represent $12.6 billion (or 0.9 per cent) of the member benefits captured in the CPPP.
2. Overview and key insights
2.1 Performance Test
There was a significant decrease in the number of products that failed the PT in 2024
A total of 37 products failed the 2024 PT with platform TDPs accounting for all. Overall, 9 per cent of products with a sufficient performance history failed the test. This is a significant reduction in the number of failed products from 2023 when 97 products failed, representing 16 per cent of products with a sufficient lookback period.
MySuper for the first time has no failed products highlighting the progress made by trustees across their MySuper products. Similar progress was made for non-platform TDPs where no fails were observed. Platform TDPs still have a high failure rate with 31 per cent of products with a sufficient lookback period failing. The reduction in the number of failures was primarily driven by poor performing products exiting the industry, with 52 products ceasing, although 6 poor performing products were able to improve their performance and pass this year’s test.
Figure 2: 2023 vs 2024 performance test results
| Product type | 2023 fails | Products ceased | Other exits | Improvements | New fails | 2024 fails | Change | 2023 fail % | 2024 fail % | Change % |
|---|---|---|---|---|---|---|---|---|---|---|
| MySuper | 1 | 1 | 0 | 0 | 0 | 0 | -1 | 1.7% | 0% | -1.7% |
| Non-platform TDP | 20 | 15 | 5 | 0 | 0 | 0 | -20 | 5.7% | 0% | -5.7% |
| Platform TDP | 76 | 36 | 7 | 6 | 10 | 37 | -39 | 40.0% | 30.8% | -9.2% |
| Total | 97 | 52 | 12 | 6 | 10 | 37 | -60 | 16.1% | 8.8% | -7.3% |
Out of the 37 failed products, 27 products (73 per cent) failed for the second time and will now be prohibited from accepting new members. When looking deeper into these products, 11 had an improvement in their PT metric despite still failing.
Members may select TDPs for other reasons beyond performance, but trustees need to ensure that products failing the PT continue to be provided in their members’ best financial interests.
Two trustees are responsible for the failed products in the PT. This comprises N. M. Superannuation Proprietary Limited with 36 products (97 per cent of fails) and I.O.O.F. Investment Management Limited with one product (3 per cent of fails). A similar concentration was seen in the 2023 PT when N. M. Superannuation Proprietary Limited and trustees under the Insignia Financial accounted for 74 out of 76 platform product fails although the Insignia trustees accounted for a significantly larger number of fails (48). APRA has heightened engagement with these trustees given the failed products, to ensure the trustees are taking the necessary actions to improve these products.
The investment component of the PT was the primary driver of product fails
The investment component of the PT was the primary driver of fails, with 32 out of the 37 failed products having a return component less than the pass threshold of minus 0.50 percentage points per annum. These products failed the PT through poor investment performance alone, before fees and costs had even been considered, and would need a positive fee component to pass the test. This was more pronounced than last year when 73 out of 97 had a return component below the threshold of minus 0.50 percentage points per annum.
Almost all failed products had high administration fees and costs with 36 out of the 37 failed products having fees and costs above their relative peer benchmarks. This was a significantly higher proportion than last year when 63 out of 97 had fees and costs above their benchmarks.
MySuper products had strong performance collectively with a median investment return component of 0.41 per cent, up from 0.34 per cent in 2023. Non-platform TDPs also had strong performance collectively with a median investment return component of 0.33 per cent, up from 0.32 per cent in 2023. MySuper had a BRAFE of 0.27 percent while non-platform TDPs had a BRAFE of 0.26 per cent. These did not change materially from 2023, which was expected as many of these products had already reduced fees and costs considering the increased transparency from the PT and APRA’s heatmaps.
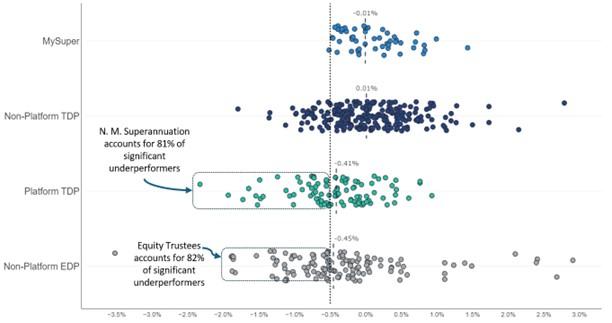
Platform TDPs improved their collective investment performance with the median investment return component improving by 20 basis points from -0.52 to -0.32 per cent. However, Platform TDPs still show significant underperformance on average. The BRAFE has increased from 0.54 per cent to 0.57 per cent. Platform TDPs have a much larger distribution of results compared to other product types in the PT (refer to Figure 3 below).
Figure 3: Performance Test Metric distribution
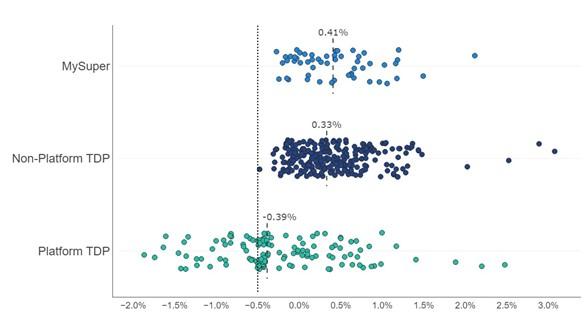
The drivers of these performance results and the differences across product types is discussed further in the Investment Performance and Administration Fees and Costs sections of the paper.
2.2 Investment Performance
Products that failed the PT in 2024 are also identified as performing poorly under the additional performance measures in the CPPP
This section examines product performance using the three different investment performance metrics (SRP, relative to peers and the PT investment component). The CPPP also assesses investment performance over multiple time periods, however performance over 10 years is the focus of this paper as it more closely aligns with the investment time horizons of most members.
Assessing investment performance using a variety of metrics that factor in a range of investment management variables, such as strategy implementation, effective asset selection and peer comparison provides additional insights.
When looking at a broad set of investment performance metrics a number of products are underperforming
In 2024, all products that failed the PT were also identified as having poor performance under APRA’s additional performance metrics in the CPPP (defined as underperforming the average of the 10-year metrics by at least 0.50 percentage points per annum). APRA’s additional investment performance metrics also identified other products as performing poorly, in addition to those identified in the PT, particularly in relation to a simple reference portfolio (SRP) and their peers on a risk-adjusted basis.
- 38 non-platform TDPs are significantly poor performing when assessed across the full complement of investment metrics over 10 years (refer Figure 4 below).
- The variation between the number of products identified as poor performing between the PT and APRA’s additional performance metrics is driven by products underperforming when making strategic asset allocation decisions compared to an SRP as seen in Figure 6, and/or poor performance on a risk-adjusted basis.
- 43 platform TDPs are significantly poor performing when assessed across the full range of investment performance metrics over 10 years, with 28 of these having also failed the PT (refer Figure 5 below).
- The variation between the number of products identified as poor performing between the PT and APRA’s additional performance metrics is once again driven by performance relative to an SRP as seen in Figure 6, as 94 (96%) platform TDPs failed to add value from strategic asset allocation decisions.
Figure 4: 10-year non-platform TDP APRA additional investment performance average metric and PT investment component
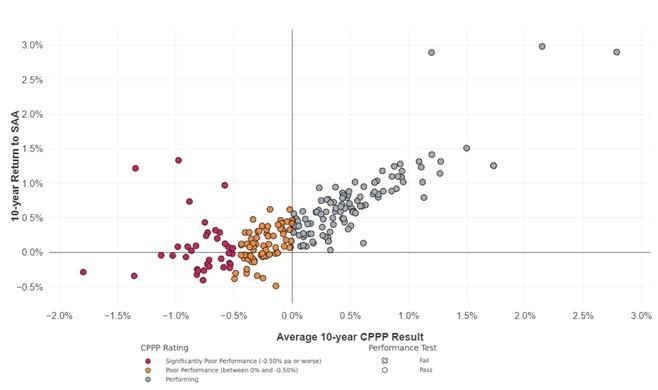
Figure 5: 10-year platform TDP APRA additional investment performance average metric and PT investment component
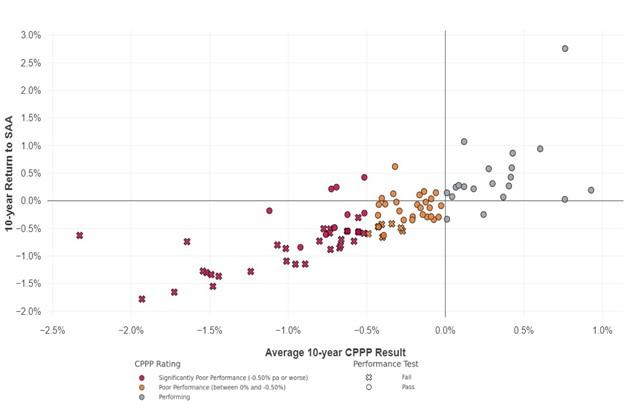
Figure 6: 10-year returns to SRP by Product Type
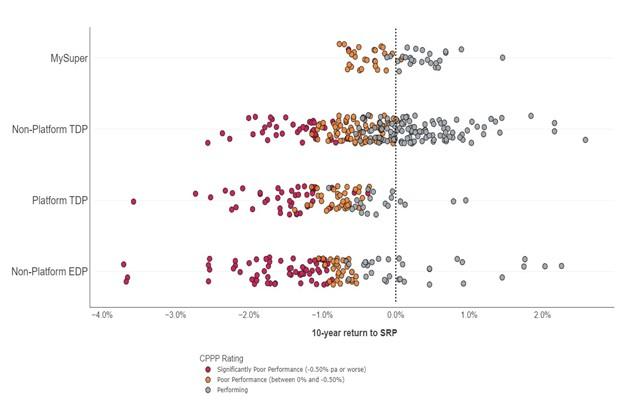
When assessing the performance of non-platform EDPs, 75 per cent experienced poor performance, with nearly 49 per cent significantly underperforming. Trustees offering non-platform EDPs are not involved in setting the SAA or implementing the investment strategy and as such, are not currently subject to the PT. However, trustees are responsible for monitoring their performance to ensure they are in their members’ best financial interests.
There is a concentration of poor investment performance in a small number of trustees offering choice products
Underperformance is primarily concentrated in choice products being offered by a small number of trustees that have common elements in their business models (refer to Figure 7 below). In the platform TDP segment, entities focus on providing access to a wide range of investment menus to give members greater flexibility in the construction of their portfolios. Entities in the non-platform EDP segment also offer similar wide ranging investment menu choices using externally managed intermediaries. In both business models, the use of additional intermediaries to provide extra choice and flexibility generates an additional layer of fees and costs that act as a drag on net performance. This is evident when looking at the investment fees and costs of platform TDPs and non-platform EDPs, which account for 88 per cent of products with significantly high investment fees and costs.
Figure 7: Concentration of poor investment performance in trustees
2.3 Administration Fees and Costs
Platform TDPs charge higher administration fees and costs than other product types, which may be particularly detrimental to members with lower account balances
Superannuation administration fees and costs cover expenditure incurred by trustees in the day-to-day operations of a fund. Administration fees and costs are in most instances levied on members at the product level or at the product and menu level for products on platforms. The analysis presented below is at the product level for all products except Platform TDPs which is presented at the product and menu level.
High administration fees and costs can erode members’ account balances over time, leaving members in a worse financial position in retirement than other members who were in products with lower administration fees and costs. Trustees should examine the drivers behind their significantly higher administration fees and costs and whether they are able to become more efficient so they can reduce their fees and costs.
MySuper products are simple and low-cost offerings created for disengaged members who do not make an active choice about their superannuation. MySuper products have materially reduced administration fees and costs since the introduction of the first APRA heatmap in 2019. The median administration fees and costs for a member with a $50,000 account balance was 0.27 per cent or $136 per annum this year. These default offerings serve as a reference point for cost competitive administration fees and costs across the industry.
Non-platform TDPs provide engaged members with a range of investment strategies in addition to MySuper products. In many cases, these products have the same services and features as MySuper products and are often provided on the same fee structures and included within the same Product Disclosure Statements. These products have a similar median administration fee to MySuper products with a value of 0.28 per cent or $138 per annum ($50,000 balance).
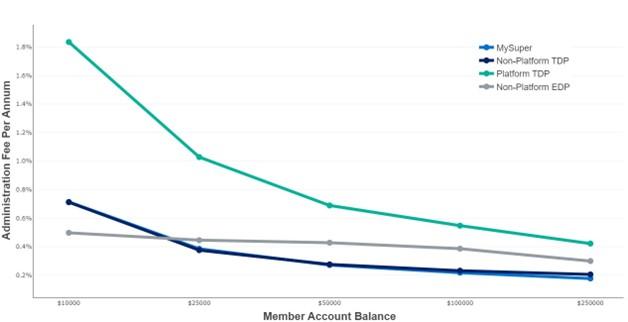
The flexibility and choice provided through superannuation platforms comes at a cost.
Platform products are designed for high balance members who want a flexible offering to create personalised investment portfolios in line with their own risk profile. In most cases, this occurs through the assistance of a financial adviser. This flexibility comes at a cost, with platform TDPs having significantly higher administration fees and costs than other product types at all account balances assessed. This cost is in most instances charged through an access fee, where a member is charged an upfront dollar fee to gain access to the product offerings on the platform. Although, the median administration fee for Platform TDPs drops significantly as member balances increase, they are generally higher compared to other market segments. For a member with a $50,000 account balance the median administration fees and costs is 0.69 per cent or $345 per annum.
There is a concentration of trustees that offer the highest cost platform products. Macquarie (2) and AMP’s Wealth Personal (6) constitute 8 of the 10 platform products above the 75th percentile of administration fees and costs (for $100,000 account balance).
Trustees need to have robust product governance in place to ensure they meet their product design and distribution obligations under ASIC Regulatory Guide 274. This includes determining an appropriate target market and ensuring the distribution of the product is directed towards this target market. In the case of platform products, this is likely to be conditions that help target members that have both appropriate balances and investment needs to take advantage of the flexibility and services these products offer, as platforms come with a significant cost that will act as a drag on net investment performance that will be particularly acute for low balance members.
Figure 8: Administration fees and costs across product types
Non-platform EDP products have significantly higher fees and costs than MySuper and non-platform TDPs but are more affordable than platform offerings with a median administration fee of 0.43 per cent or $214 per annum ($50,000 balance). Over 87 per cent of these products are closed to new members and have much higher fees and costs (median of 0.44 per cent) than open offerings (median of 0.27 per cent).
APRA expects trustees to investigate closed products with higher fees and costs to determine if the fee structures can be improved or if members can be moved to open products with more competitive fees and costs without causing significant member benefit loss. Trustees also need to ensure that higher administration cost non-platform EDP products that are offered with specialised features are being utilised by members to ensure they are receiving a benefit from the increased fees and costs.
Significantly higher administration fees and costs have persisted in smaller sized RSEs, particularly in the choice segment of the market.
There are four MySuper products with administration fees and costs that are significantly higher than their peers (illustrated in Figure 9 as above the crimson threshold across three or more account balances), accounting for $13.3 billion in assets representing close to 1.2 per cent of the MySuper market. Three of these are small funds (less than $10 billion in assets), while the other is a large fund ($50-$100 billion in assets).
Figure 9: Administration fees and costs charged at $50,000 account balance
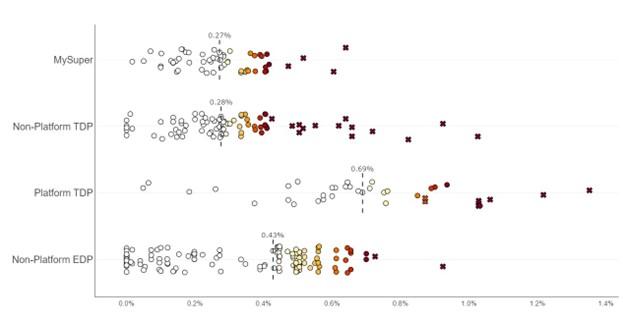
In the choice segment, there are 25 products which are classified as having significantly higher administration fees and costs. Of these, 9 are Platform TDPs (out of 39) with $75.9 million in member benefits and account for only 0.4 per cent of assets in platform TDPs. Non-platform TDPs have 14 in this category (out of 89), totalling $9.2 billion in member benefits and accounting for 2.5 per cent of assets. Lastly, non-platform EDPs have two products (out of 131), and account for a minute slice of assets within this market segment. For non-platform TDPs, Equity Trustees Superannuation Limited (7) and Diversa Trustees Limited (6) account for 13 of the 14 significantly higher administration fees and cost products, highlighting a significant concentration amongst these trustees.
Platform TDPs with significantly higher administration fees and costs are being offered by medium and large-sized funds, whilst the non-platform TDPs and non-platform EDPs are all offerings by small funds.
Most products with significantly higher administration fees and costs are offered by smaller funds, reinforcing that scale is a key driver in promoting competitive fees and costs. Trustees of smaller funds that are unable to offer competitive fees and costs because of smaller scale should consider how members’ best financial interests are best served and whether these funds should continue to operate independently in the superannuation industry.