Testing resilience: The 2017 banking industry stress test
Insight Issue 3 2018
Stress testing plays an important role for both banks and APRA in testing financial resilience and assessing prudential risks. This article provides an overview of APRA’s approach to stress testing, with insights into how APRA developed the 2017 Authorised Deposit-taking Institution (ADI) Industry Stress Test. This builds on the recent speech by APRA Chairman Wayne Byres, “Preparing for a rainy day” (July 2018), which outlined the results from the 2017 exercise.
Why stress test
The aim of stress testing is, broadly, to test the resilience of financial institutions to adverse conditions, including severe but plausible scenarios that may threaten their viability. The estimation of the impact of adverse scenarios on an entity’s balance sheet provides insights into possible vulnerabilities and supports an assessment of financial resilience. It can be a key input into capital planning and the setting of targets, and in developing potential actions that could be taken to respond and rebuild resilience if needed.
Stress tests are particularly important for the Australian banking system, given the lack of significant prolonged economic stress since the early 1990s. As a forward-looking analytical tool, stress testing can help to improve understanding of the impact of current and emerging risks if a downturn were to occur. Stress tests provide an indication, however, rather than a definitive answer on the impact of adverse conditions, and the results will always reflect the inherent uncertainty that exists in any scenario.
Scenarios – the starting point
The starting point in developing a stress test is to design the scenarios. This is the foundation of the exercise, and it is important that scenarios are calibrated effectively and are well targeted. For industry stress tests, APRA collaborates with both the Reserve Bank of Australia (RBA) and Reserve Bank of New Zealand (RBNZ) on the design of scenarios and the economic parameters that define them. In 2017, APRA also engaged with the Australian Securities and Investments Commission (ASIC) in the design of the operational risk scenario.
Scenarios should be aligned to the purpose of the exercise. At a high level, these are guided within APRA by several objectives – namely to:
- assess system-wide and entity-specific resilience to severe but plausible scenarios;
- improve stress testing capabilities across the industry; and
- support the identification and assessment of core and emerging risks.
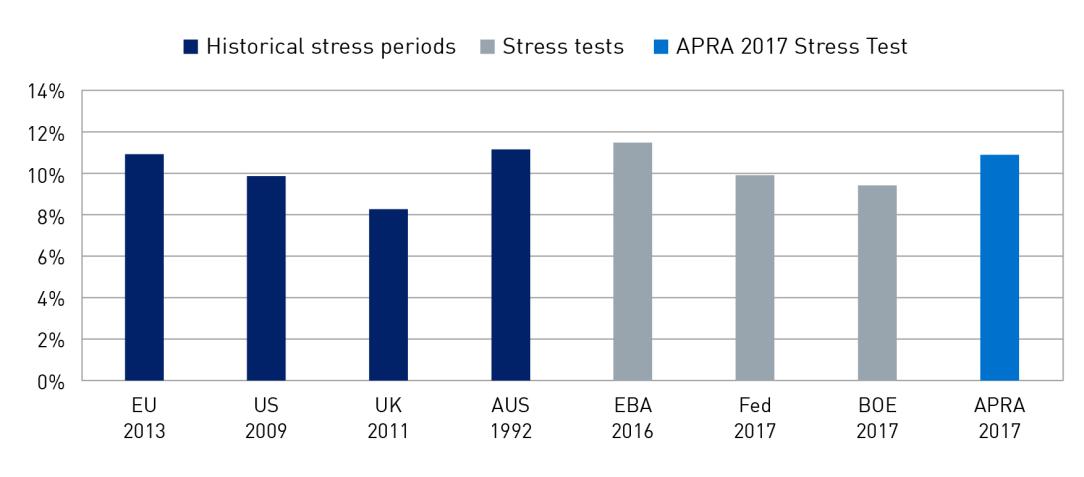
In line with these objectives, APRA developed two scenarios for the 2017 industry stress test. The first was a macroeconomic scenario with a China-led recession in Australia and New Zealand. This was considered the most severe but plausible adverse economic scenario for the banking system at the time.[1] In this scenario, there was assumed to be a fall in Australian GDP of 4 per cent, while house prices declined 35 per cent nationally over three years. The chart below provides an indication of the severity of the scenario: it shows that the assumed peak unemployment rate in the scenario was similar to the 1990s recession in Australia, the United States’ experience in the global financial crisis (GFC), as well as recent overseas regulatory stress tests.
The second scenario involved the same macroeconomic parameters, with an additional operational risk event added. This was designed to test bank resilience beyond traditional economic risks and to consider other vulnerabilities. In this operational risk scenario, APRA asked the participating banks to identify a material operational risk event involving conduct risk and/or mis-selling in the origination of residential mortgages.[2]
The banks chosen for the exercise were selected based primarily on scale, enabling a clear system-wide view to be generated. The 2017 stress test covered 13 of the largest banks with aggregate assets of nearly 90 per cent of the system, as well as the leading lenders mortgage insurers. It included both the major banks and smaller entities that have a significant presence in particular regions or asset classes.
The testing process
The 2017 stress test was run in two phases. In the first phase, banks generated results using their own stress testing methodologies and models.[3] The results of this phase varied by differences in the risk characteristics of each bank, as well as by how they interpreted and modelled the scenarios.
In the second phase, APRA provided more prescription with specified risk estimates for loan portfolios and other assumptions. This enabled greater comparability across the banks and more consistency in the results. The APRA estimates were developed based on the banks’ results from the first phase, APRA’s own internal modelling, historic and peer stress testing benchmarks, internal and external research and expert judgement.
The estimates were also differentiated based on inherent risk characteristics. For example, riskier interest-only loans were assumed to be more likely to default and losses were estimated to be greater for loans with higher Loan to Valuation Ratios (“LVRs”). For the operational risk scenario, APRA defined key elements and estimates to be applied by the banks, based on research of overseas experience as benchmarks for potential impacts.
Interpreting the results
The table below summarises some key results from the macroeconomic scenario. As important as the quantified outcomes are the lessons learned and implications of the exercise. Stress testing should not be an academic exercise, but should be used to inform assessments of resilience, risks and capacity to respond to stress.
In analysing the results, APRA assessed not only the impact on capital, but also the effects on profitability and loan portfolios. The differences between phase 1 (based on bank’s own modelling) and phase 2 (based on APRA risk estimates) can also shed light on bank stress testing modelling capabilities.
| Macroeconomic scenario – aggregate results | Phase 1 | Phase 2 |
|---|---|---|
| Peak to trough decline in Common Equity Tier 1 capital | -2.87% | -3.21% |
| Peak to trough decline in Return on Equity | -9.86% | -12.05% |
| Peak credit loss rate[4] | 0.81% | 0.90% |
Macroeconomic scenario
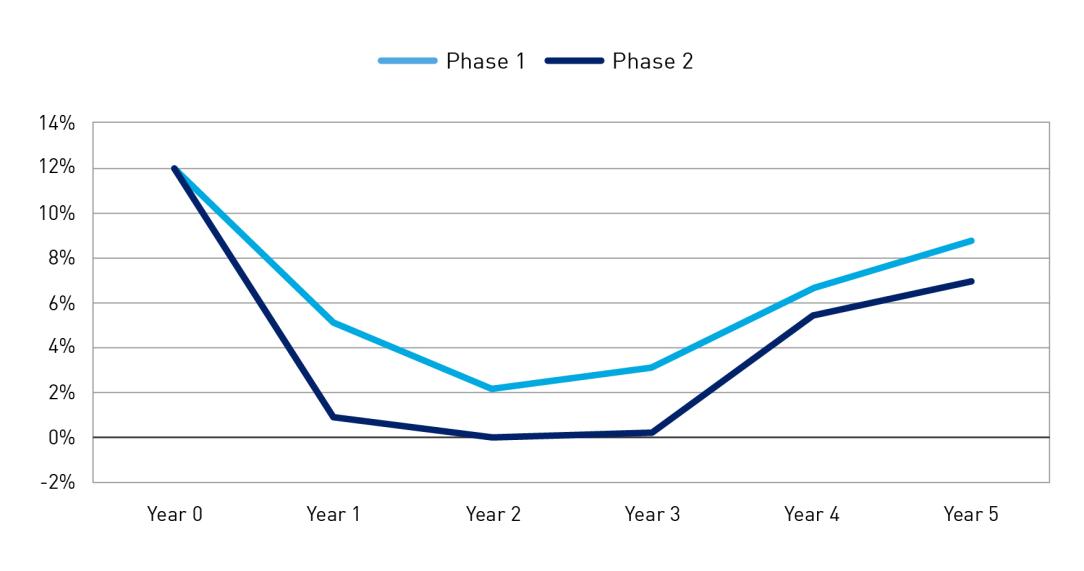
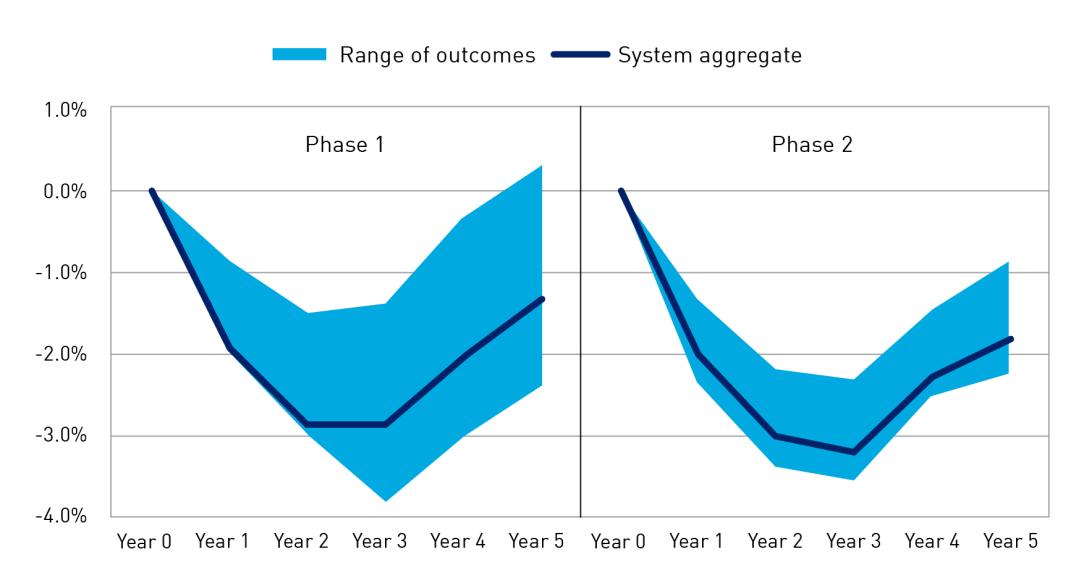
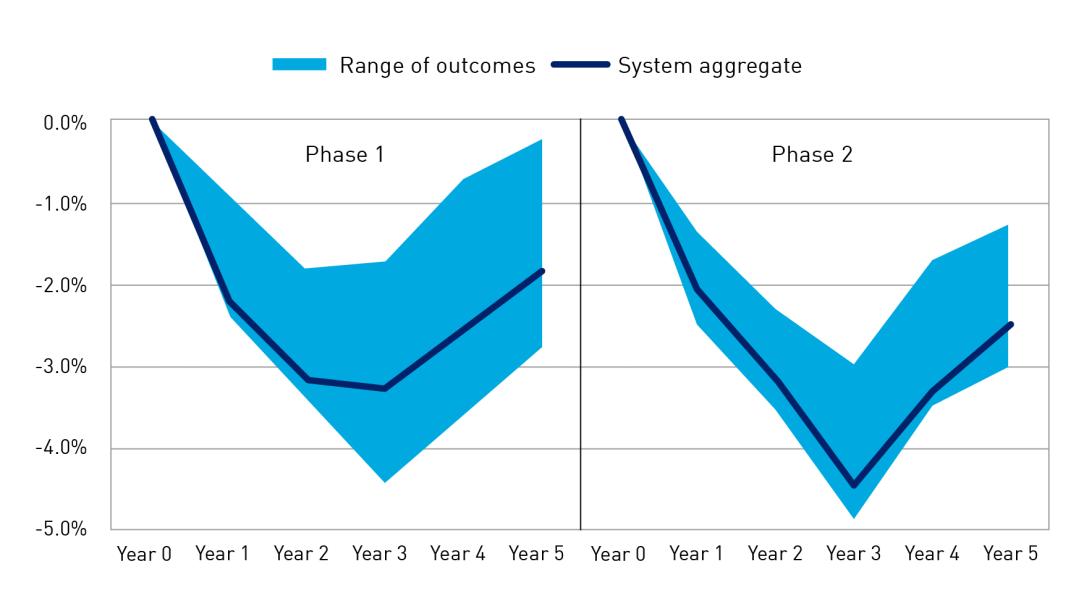
Given the design of the scenario, the impact on the participating banks was material. The results show that in this scenario the decline in profitability was severe and occurred quickly. Return on equity (ROE) in aggregate fell materially in the first two years before recovering after year three. The impact on profitability led to a significant fall in capital in both phases, as shown in Chart 3. There was, however, a wide range in results across banks in both phases.[5]
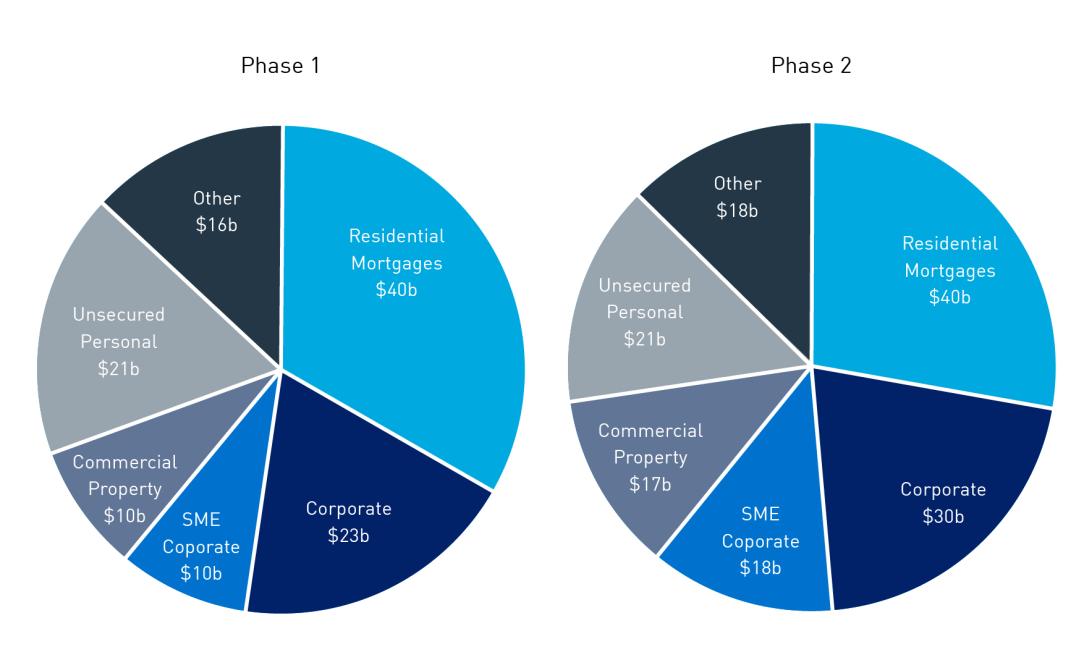
The losses were driven by bad debts in residential mortgage lending, corporate lending and other credit portfolios, as well as lower net interest income and losses on large single counterparties. Across the mortgages portfolios of the banks, aggregate losses were similar in both phases and although the mortgage portfolio contributed the largest aggregate loss, the loss rate was lower than business lending and other consumer lending portfolios.[6] The banks also modelled the impact of the scenario on liquidity and funding positions; most banks were able to maintain their liquidity with a liquidity coverage ratio (LCRs) above 100 per cent (or initiated strategies to restore their LCR within a reasonable timeframe).
Operational risk scenario
In the second scenario, the impact of the operational risk event led to a more severe capital outcome, as shown in Chart 5. The operational risk events modelled by the banks in Phase 1 represented a wide range of potential risks, including broker fraud, inappropriate product design and sales practices, inappropriate verification and documentation, overstatement of valuation errors at origination, and serviceability errors. The impact of the operational risk event in Phase 2 based on APRA-defined assumptions was, however, more severe.
Conclusions and lessons learned
Following industry stress test exercises, APRA provides participating entities with formal feedback. In the 2017 stress test, APRA noted the importance of ongoing improvements in modelling capabilities and developing better internal model governance and discussions on results. In practice, a stress event is unlikely to play out exactly as designed and simulated in hypothetical scenarios, reinforcing the need to continue to stress test and enhance stress testing capabilities.
In APRA’s view, the results of the 2017 exercise provide a degree of reassurance: ADIs remained above regulatory minimum levels in what was a very severe stress scenario. In addition, the results were presented before taking into consideration management actions that would likely be taken to rebuild capital and respond to risks in the scenarios.[7] The impact on profitability, loan portfolios and capital would, however, be substantial: this underlines the importance of maintaining strong oversight and prudent risk settings, unquestionably strong capital and ongoing crisis readiness.
Footnotes
- The RBA’s Financial Stability Review in October 2016 highlighted the risks posed by high and rising levels of debt in China, at a time of slowing growth and signs of excess capacity.
- Overseas experience in the GFC has highlighted that operational risk events can impact the financial system alongside an economic downturn. For example, in the US, there was a significant impact from sub-prime mortgage lending, while in the UK, there was additional stress related to the mis-selling of payment protection insurance.
- In order to ensure consistency for the exercise, APRA provided guidance and templates for results.
- This represents the credit loss rate in the most severe year of the stress. Aggregate losses over the duration of the stress period were higher.
- The range presented in the charts is the interquartile range (middle 50 per cent of entities).
- Banks determine credit losses by calculating the likelihood of the loans defaulting (“probability of default”) and then the actual loss on the defaulted loans (“loss given default”) which is then applied to the stressed value of the asset. For mortgages, insurance on higher LVR loans helps to mitigates losses.
- These actions include raising equity, loan repricing, cost cutting, tightening lending standards and balance sheet measures. Within this set, the cornerstone action was typically equity raisings, as a relatively quick step. In the operational risk scenario, the participating banks raised around $40bn in equity, almost twice the level as during the GFC. The assumption that banks were last to market challenged thinking around the potential capacity and pricing implications.