Comprehensive Product Performance Package - Methodology Paper
Introduction
This paper outlines the methodology that APRA has used to produce the Comprehensive Product Performance Package (‘the CPPP’). The CPPP provides comparable information on the investment returns and fees and costs of the MySuper industry and a segment of the Choice industry within the superannuation sector. The CPPP also publishes the results of the Government’s legislated annual performance assessment. The CPPP highlights areas of poor outcomes for members and enables like-for-like comparisons between different offerings.
APRA expects RSE licensees to manage investments in the best financial interests of members. The CPPP is intended to improve transparency, hold trustees accountable for outcomes they deliver to members, and to foster a culture of continuous improvement across the superannuation industry. The primary users of the CPPP are RSE licensees, although it provides insights that benefit a wide range of stakeholders including policymakers and advisers. APRA also uses the CPPP as part of its supervision activities to ensure RSE licensees are focussed on member outcomes.
The CPPP does not provide information on all the relevant factors that should be considered when assessing the outcomes or appropriateness of a particular superannuation offering. It should not be used in isolation to inform decisions regarding choice of a superannuation product.1
Scope of the CPPP
The superannuation industry offers members a wide variety of products across the MySuper and Choice sectors. These products can have significant variability in their investment strategies, fees and costs, method of access and additional features and services they provide to members.
There is significantly more variability in the Choice sector than the MySuper sector, as MySuper products are designed to be simple, generic, low-cost and comparable. In the Choice sector, RSE licensees may offer multiple products that incorporate multiple investment menus, which may include:
- A wide range of investment options, including Multi Sector options (such as balanced, growth or conservative), Single Sector options (such as Australian equities or cash) and direct investments (such as shares or term deposits), to suit the different needs and risk profiles of members.
- Additional features and services, including additional online website functionality, member reporting, and other member tools.
Superannuation members access Choice investment options through different superannuation products and investment menus that may involve different fee and cost structures and, potentially, different return outcomes.2 The terminology “investment pathway” is used in the CPPP to describe each of these unique combinations of superannuation product, investment menu and investment option. Fees and costs metrics in the CPPP have been calculated for each investment pathway to reflect member experience depending on the route taken to access a Choice investment option. The investment return metrics are presented at the investment pathway level, however the return that is published is the return of the underlying investment option, as investment performance is typically driven by the performance of the underlying investment option.
The CPPP includes a wide range of MySuper and Choice investment options. The scope of the CPPP is outlined in Figure 1.
Figure 1. Scope of the CPPP
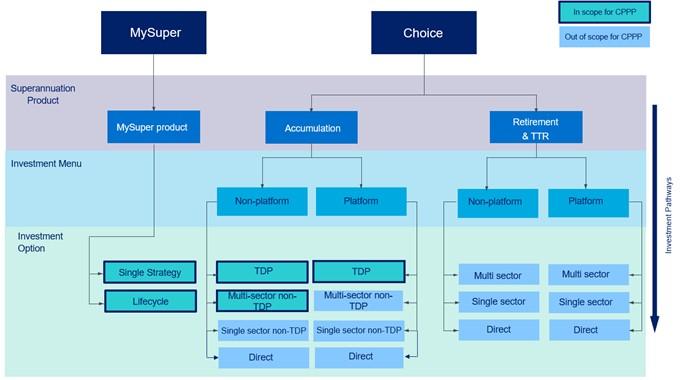
As highlighted in Figure 1, APRA’s area of focus for the CPPP is (i) MySuper products and (ii) Choice investment options that:
- are available through accumulation products
AND are either:
Trustee Directed Products (‘TDPs’)3; or
Multi-sector, non-TDPs that are available through a non-platform investment menu.
Retirement and transition-to-retirement (‘TTR’) products (including account-based pension products and annuity style products and investment options) are excluded. Single Sector and Direct investment options are also excluded.
The CPPP covers investment pathways offered by APRA-regulated RSEs with more than six members.
The CPPP includes investment pathways that are:
open to new members; and
closed to new members (but have existing members) whether closed at the product level, investment menu level and/or investment option level.
Investment pathways with the following elements are out of scope for the CPPP:
- Custom fee arrangements. The pathways selected all correspond to a ‘Standard Fees And Costs Arrangement Type’ as reported in SRS 605.0. Return outcomes and fees and costs metrics may differ for otherwise identical pathways that are subject to a ‘Custom Fees and Costs Arrangement Type’, which are not offered to the general membership of the fund (for example, a discount arrangement for a large participating employer).
- Defined benefit products, Whole of life or endowment products, and investment options offered for insurance purposes only. Investment returns do not directly impact or fully account for the return outcomes experienced by members in these pathways. For defined benefit interests, employers generally bear the investment risk. A small number of investment options that remain identified as ‘accumulation’ in SRS 605.0 have been excluded given they are either bundled with insurance arrangements or have the sole purpose of providing insurance which do not make them comparable to other accumulation products.
CPPP elements and presentation
3.1 CPPP metrics
The CPPP provides information on relative outcomes for members, in particular poor outcomes, of the in-scope investment options. The CPPP’s expanded view metrics include:
- legislated performance test results and metrics;
- investment return metrics over three, five, seven and ten-year time horizons; and
- administration and total fees and costs metrics covering representative member account balances of $10,000, $25,000, $50,000, $100,000 and $250,000.
3.2 Data sources and coverage of investment pathways
The CPPP uses data collected under the reporting standards developed through the SDT project to calculate all the metrics. This data is primarily collected at the investment pathway level and, as noted above, is also presented at the investment pathway level in the CPPP. The key reporting standards are SRS 605.0 RSE Structure, SRS 606.0 RSE Profile, SRS 705.1 Investment Performance and Objectives, SRS 550.0 Asset Allocation, SRS 533.0 Asset Allocation and SRS 705.0 Components of net return.
3.3 Displaying the metrics
The investment return and fees and costs metrics in the CPPP are presented with a colour overlay that provide stakeholders with a visual illustration of the outcomes provided by investment pathways relative to peers and appropriate benchmarks. The colour overlay focuses on investment pathways that are delivering poorer outcomes relative to other investment pathways or the selected benchmarks.
The colour overlay has a continuous colour gradient so that the CPPP emphasises areas of materially poor outcomes and is not categorising investment pathways as ‘good’ or ‘bad’ overall. The CPPP metrics have been mapped to the ‘heat’ colour scale using thresholds that best reflect each individual metric. Further detail on these scales is outlined in each of the chapters on investment returns and fees and costs.
3.4 Viewing the publication
The publication has two views, a concise view and an expanded view. The concise view shows eight key metrics that APRA considers particularly important for assessing member outcomes based on underlying analysis of the data. APRA will review these metrics periodically to ensure the most relevant and important measures of member outcomes are highlighted.
Table 1. Concise view metrics
| Area | Concise View Metric |
|---|---|
| Performance Test Metrics (MySuper, Platform TDPs and Non-Platform TDPs only) | Performance Test Metric |
| Performance Test Result | |
| Investment Returns | 10 year Net Investment Return (NIR) p.a. / 10 year Gross Investment Return Net of Fees (GIRNF) p.a.4 |
| 10 year NIR relative to strategic asset allocation (‘SAA’) Benchmark Portfolio p.a. / 10 year GIRNF relative to SAA Benchmark Portfolio p.a. | |
| Fees and Costs | Administration fees and costs charged ($50,000 account balance) |
| Administration fees and costs charged ($100,000 account balance) | |
| Total fees and costs charged ($50,000 account balance) | |
| Total fees and costs charged ($100,000 account balance) |
The CPPP in its expanded view shows up to 31 metrics (depending on the product type) that APRA uses to evaluate the outcomes of each of the investment pathways. The expanded view provides stakeholders with broader insights into investment returns and the impact of fees for different member account balances, as well as the components of the performance test results.
Table 2. Expanded view metrics
| Area | Concise View Metric |
|---|---|
| Performance Test Metrics (MySuper, Platform TDPs and Non-Platform TDPs only) | Performance Test Metric |
| Performance Test Result | |
| Actual return minus benchmark return | |
| Representative administration fees and expenses (‘RAFE’) | |
| Benchmark representative administration fees and expenses (‘BRAFE’) | |
| Investment Returns | 3, 5, 7 and 10 year Net Investment Return (‘NIR’) p.a. / 3, 5, 7 and 10 year Gross Investment Return Net of Fees (‘GIRNF’) p.a. |
| 3, 5, 7 and 10 year NIR relative to SAA Benchmark Portfolio p.a. / 3, 5, 7 and 10 year GIRNF relative to SAA Benchmark Portfolio p.a. | |
| 3, 5, 7 and 10 year NIR relative to Simple Reference Portfolio p.a. / 3, 5, 7 and 10 year GIRNF relative to Simple Reference Portfolio p.a. | |
| 3, 5, 7 and 10 year Net Return p.a. (MySuper only) | |
| Fees and Costs | Administration fees and costs on all representative balances ($10,000, $25,000, $50,000, $100,000 and $250,000) |
| Total fees and costs on all representative balances ($10,000, $25,000, $50,000, $100,000 and $250,000) |
An interactive version of the CPPP is hosted on the APRA website, which provides a user-friendly interface to view the performance of investment pathways, including filtering and sorting functionality.
3.5 Growth asset allocation categories for Choice options
The CPPP displays information for a large number of investment pathways. Choice products typically offer investment menus that contain a range of multi-sector investment options. The investment options that underlie the investment pathways have different risk profiles with different allocations to growth asset classes.
To enable comparisons between different investment pathways of a similar risk profile, APRA has categorised the underlying investment options into “Strategic Growth Asset Allocation” categories for the Platform TDP, Non-platform TDP and multi-sector, non-Platform, Externally Directed Product (‘EDP’) options. The six “Strategic Growth Asset Allocation categories” are: 0-40%, 40-60%, 60-75%, 75-90%, 90-100% and “>100%”. There is a column in the CPPP to allow users to filter to categories of interest based on this criterion.
3.6 Anonymised display of member accounts and assets to protect privacy
To protect the privacy of individual members, APRA has anonymised certain data by publishing a value of ‘<20’ for member accounts and a ‘*’ for member assets for any investment pathways with less than 20 member accounts. The member accounts column in the CPPP has been rounded to the nearest 10 to ensure the privacy of individual members is protected. APRA confirms that these measures do not have a material impact on the CPPP methodology, the CPPP tool, or the results generated.
Performance Test Metrics
4.1 Performance Test metrics
The legislated performance assessment is part of a suite of Government reforms that commenced in July 2021 which are designed to optimise member outcomes. The intent of the performance assessment is to hold RSE licensees accountable for the performance they deliver and to improve their products through greater transparency and legislated consequences.
APRA administers the performance test annually for the required population of superannuation options and publishes the results of the assessment on APRA’s website by 31 August. In addition, the CPPP includes the components of the performance test results to assist entities in understanding their performance test outcomes and target their attention to areas where they can uplift performance.
The methodology for the legislated performance assessment is contained in Section 9AB of the SIS Regulations: Federal Register of Legislation - Superannuation Industry (Supervision) Regulations 1994.
Investment Return Metrics
APRA has analysed a number of different investment metrics that assess returns on a risk-adjusted basis and consider an RSE licensee’s returns relative to peers. APRA notes that the long-term investment return is a critical driver of outcomes for members, and that assessing returns across different metrics and over different time periods provides insights into the drivers of performance and the sustainability and consistency of investment returns over time. The CPPP measures investment returns over three, five, seven and ten-year time horizons, where this history exists.
The investment return metrics are presented at the investment pathway level, however the return that is published is the return of the investment option. This is because investment performance is most heavily affected by the underlying investment option, rather than the product or investment menu. Where the investment return varies across the investment pathways, the lowest return pathway is taken to calculate the option level return with the returns of all other pathways published in a separate tab of the publication file.
5.1 Benchmark portfolio metrics
APRA has constructed benchmark portfolios as part of the analysis to provide risk-adjusted insights into the returns of each investment option. The Net Investment Return (‘NIR’) / Gross Investment Return Net of Fees (‘GIRNF’)5 of each investment option has been measured against a Simple Reference Portfolio (‘SRP’) and a Strategic Asset Allocation (‘SAA’) benchmark portfolio; both portfolios are specific and tailored to reflect the investment strategy and level of risk of the underlying investment option.
Reference and benchmark portfolios are the primary measures that APRA uses to evaluate the investment returns of investment options. These measures provide objective insights into an RSE licensee’s ability to add value for its members. Where an RSE licensee’s investment process utilises active management, positions portfolio asset allocation differently to strategic asset allocation, or invests in illiquid or complex assets, it is expected to be able to demonstrate the value-add (after fees, costs and taxes) from these activities over time.
Appendix A provides the formulas used to calculate the returns for the SRP and SAA benchmark portfolio. Appendix B provides detail on the indices used to construct the SRP and SAA benchmark portfolios.
5.2 Simple Reference Portfolio
The SRP is a notional portfolio of passive, low-cost, liquid investments. The purpose of the SRP is to measure the value an RSE licensee has generated for its members through its value-adding activities, such as its strategic asset allocation decisions and investment implementation decisions. A bespoke SRP is created for each investment option to appropriately reflect its own risk profile.
The SRP consists of a growth portfolio and a defensive portfolio utilising only equities, bonds and cash (refer Table 3 below). The risk profile of each investment option has been established by applying a consistent definition of growth and defensive assets to the asset allocation data of the underlying investment option, as outlined in Table 4 below.
Table 3. Growth and Defensive Portfolio (Asset breakdown)
| Growth Portfolio | % | Defensive Portfolio | % |
|---|---|---|---|
| Australian equity | 50 | Australian fixed income | 40 |
| International equity (hedged; international economy type not applicable) | 25 | International fixed income | 40 |
| International equity (unhedged; international economy type not applicable) | 25 | Australian Cash | 20 |
Table 4. Growth/Defensive Classification
| SAA Asset Class | Growth / Defensive classification |
|---|---|
| Equity, Listed Property, Listed Infrastructure | 100% Growth |
| Unlisted Property, Unlisted Infrastructure, Credit, Growth Alternatives | 75% Growth, 25% Defensive |
| Alternatives | 50% Growth, 50% Defensive |
| Fixed Income, Defensive Alternatives | 25% Growth, 75% Defensive |
| Fixed Income Excluding Credit, Cash | 100% Defensive |
A return is calculated for both the growth portfolio and the defensive portfolio by applying index returns (see Appendix B for details of indices used) for each asset class and the weightings in Table 3. This provides a benchmark against which the ability of an RSE licensee to develop and implement an effective investment strategy can be measured. The SRP is not intended to be an indicator of how an RSE licensee should invest; rather, it provides a benchmark to assess returns suitable for the long-term horizon of superannuation and is based on the underlying investment option’s target risk-return expectations.
The returns on the growth and defensive portfolios are then combined to determine the benchmark return for each investment option using the specific growth / defensive asset allocation weightings for the investment option in Table 4.
The return for each investment option is then compared to the return on its bespoke SRP to determine the return of the investment option relative to the SRP over the period (i.e. whether it under/outperformed the benchmark).
5.3 SAA benchmark portfolio
The purpose of the SAA benchmark portfolio is to assess the value generated through an RSE licensee’s implementation of its investment strategy. The SAA benchmark portfolio has been created using the reported SAA for the investment option. The benchmark portfolio assumes investment in listed passive benchmarks for each listed asset class and unlisted benchmarks for unlisted property and infrastructure. The asset class benchmarks adopted match the indices used in the annual performance test.
5.4 Reference/benchmark portfolio assumptions
To ensure an appropriate comparison can be made between the returns of investment options to the reference and benchmark portfolios, APRA has incorporated some adjustments into the calculations of reference and benchmark portfolio returns. In particular:
- Each asset class benchmark has been adjusted to consider long-term assumptions for actual and accrued tax, based on respective income and capital components (and franking credits for the Australian equity benchmark). See Appendix B for the tax assumptions used in this analysis.
- Where available, APRA has selected global indices that are adjusted to reflect the withholding taxes applicable for an Australian institutional investor, to remove any potential understatement of index returns arising from the presence of double taxation treaties. APRA considers the use of these benchmarks to be good practice, particularly where there are wider implications such as the payment of performance-based fees and remuneration.
- Fee assumptions have been incorporated into the index returns to reflect the fees that would be payable by an institutional investor investing passively. Estimates were derived using relevant exchange traded funds (‘ETFs’) as a reference point. See Appendix B for the fee assumptions used in this analysis.
- Fully hedged benchmarks have been used by APRA for international property, infrastructure, and fixed interest, where industry practice is that hedging is close to 100%.
- APRA has used the reported currency hedging ratios for the International Equities asset class, where available, to calculate the split between hedged and unhedged international equity for the SAA reference portfolio. Where only currency exposure is reported at the investment option level in SRS 550.0 Asset Allocation, the asset class hedging level for International Equities is assumed to equal 1 minus the total strategic currency exposure divided by the total strategic allocation to international assets.
- Where available, SAA data reported at the subsector level has been used instead of sector level data to ensure the most representative SAA data is used.
- The returns on both the SRP and the SAA benchmark portfolio have been calculated using the historical SAA data sources noted above. APRA has made assumptions on how strategic sectors and subsectors captured in SRS 550.0 Asset Allocation are mapped to the asset classes used for the CPPP (which match the covered asset classes used in the annual performance test). These assumptions align to the methodology used in the performance test.
- Where asset domicile for a particular asset class is not reported, a benchmark of 50% Australian and 50% International has been used.
- When a currency hedging ratio has been reported against a domicile type of “Not applicable” or “Not specified”, the benchmark asset allocation is split 50/50 but the hedging ratio is kept the same and fully allocated to the international domicile split (i.e., Australian domicile has no hedging ratio value allocated).
- When a currency hedging ratio has been reported against a domicile type of “Not applicable” or “Not specified”, the benchmark asset allocation is split 50/50 but the hedging ratio is kept the same and fully allocated to the international domicile split (i.e., Australian domicile has no hedging ratio value allocated).
- Where listing type is not reported, allocations to property and infrastructure are assumed to be 50% listed and 50% unlisted.
- Where the total of the reported SAA for an investment option is less than 100% for a quarter, the proportions to each asset class are adjusted to ensure the total is equal to 100% by dividing by the SAA values by the SAA total.
- Where asset domicile for a particular asset class is not reported, a benchmark of 50% Australian and 50% International has been used.
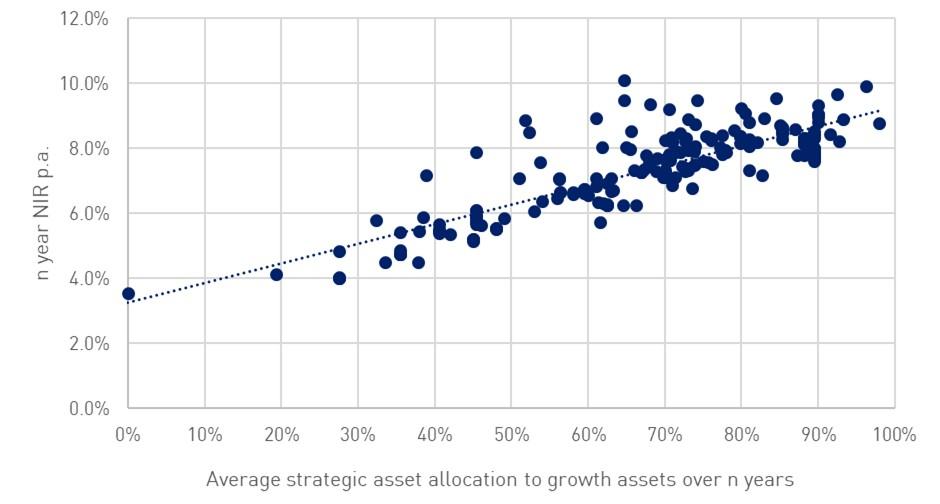
5.5 Benchmarking of absolute return metrics
Figure 2. Sample NIR peer comparison on a risk-adjusted basis
5.6 Colour overlay
The colour scale displayed in the CPPP is based on the return of the investment option relative to different metrics. The method for colouring each metric is as follows:
- NIR / GIRNF: NIR / GIRNF relative to the appropriate reference point in the NIR / GIRNF growth asset allocation trend line of the underlying investment option.
- SRP: NIR / GIRNF relative to the SRP.
- SAA benchmark portfolio: NIR / GIRNF relative to the SAA benchmark portfolio.
- NR: NR relative to the appropriate reference point in the NR growth asset allocation trend line of the underlying investment option.
Colours are applied based on the level of relative return and in line with the colour scale below:
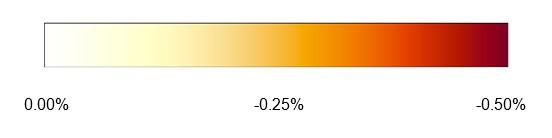
The highest concentration of colour is applied to the investment options that are delivering returns more than 0.50% below the corresponding reference point.
5.7 MySuper lifecycle strategies
Assessing the return of lifecycle MySuper products that are implemented through a number of lifecycle stages is challenging, given the investment period analysed is generally shorter than the glidepath. In addition, comparing the return of lifecycle products is complex due to the variability in design and implementation approaches across different products.
The CPPP assesses the return of each lifecycle stage based on the various metrics and also provides an overall assessment at the lifecycle product level. To assess returns at a product level, APRA has calculated a weighted average of the returns of the underlying lifecycle stages, based on the assets in each lifecycle stage at the beginning of each quarter.6 The CPPP displays the product level assessment through a colour overlay.
5.8 Combining the investment performance of investment options over time
Where a MySuper product or investment option has had a change in structure, an authorisation change or transfer of members to an different product or option over time, APRA may combine the investment return before the change with the investment return after the change to achieve one continuous return history. This may occur in two different situations:
- Within-product changes: where there have been changes to the structure or nature of the product/investment option (for example, single strategy to lifecycle) but the product/investment option continues (typically under an existing MySuper authorisation).
- Across-product changes: where a product/investment option has ceased and members have been transferred into a new product/investment option.
APRA has developed a number of principles and a methodology for combining the returns of multiple products over time which have been published in a MySuper Information Paper7 and a TDP Information Paper8 on APRA’s website.
Fees and Costs
The CPPP provides insights into investment pathway fees and costs structures, and their impact on outcomes for members. APRA has analysed the administration fees, and total fees and costs charged to members with different representative account balances and expects that these metrics will provide suitable benchmarks to RSE licensees when assessing outcomes being delivered to members. Fees and costs metrics are presented in the CPPP at the investment pathway level for members with account balances of: $10,000; $25,000; $50,000; $100,000 and $250,000.
Investment pathways have varying fees and costs structures which include flat charges and percentage-based charges, tiering arrangements, fee caps, and rebates. These have been accounted for in the calculation of the fees and costs metrics. The fee calculations in the CPPP are net of tax. See Appendix A for further details on the calculation of the fees and costs metrics.
6.1 Colour overlay
The colour scale has been applied to administration fees and costs charged for the representative account balances of $10,000; $25,000; $50,000; $100,000 and $250,000 using statistical methods to define thresholds. Colours are applied based on the level of fees charged and in line with the colour scale below:

The graduating colour scale for fees shows the relative positioning of an investment pathway’s administration fees charged based on Median Absolute Deviations (MAD). MAD is used as the measure of variability, to reduce the impact of distortion of outlier values that impact measures such as standard deviation. The MAD is calculated as follows:
- MAD = Median (absolute value (Individual fee – median of population fees))
The thresholds for the different categories of investment options are as follows:
Table 5. Distributions across the representative member account balances
| Representative Member Account Balance | Colour Graduation for fees and costs | |||
|---|---|---|---|---|
| Investment Option Type | Colour scale begins from: | Highest concentration of colour begins from: | ||
| Administration fees charged (% of $10,000 account balance) | MySuper | 0.71% | 1.05% | |
| Non-platform TDPs | 0.67% | 1.06% | ||
| Platform TDPs | 1.95% | 3.52% | ||
| Multi-sector, non-platform, EDPs | 0.50% | 0.97% | ||
| Administration fees charged (% of $25,000 account balance) | MySuper | 0.39% | 0.56% | |
| Non-platform TDPs | 0.36% | 0.52% | ||
| Platform TDPs | 1.02% | 1.43% | ||
| Multi-sector, non-platform, EDPs | 0.47% | 0.75% | ||
| Administration fees charged (% of $50,000 account balance) | MySuper | 0.27% | 0.42% | |
| Non-platform TDPs | 0.28% | 0.36% | ||
| Platform TDPs | 0.66% | 0.84% | ||
| Multi-sector, non-platform, EDPs | 0.45% | 0.62% | ||
| Administration fees charged (% of $100,000 account balance) | MySuper | 0.22% | 0.34% | |
| Non-platform TDPs | 0.23% | 0.33% | ||
| Platform TDPs | 0.42% | 0.58% | ||
| Multi-sector, non-platform, EDPs | 0.42% | 0.63% | ||
| Administration fees charged (% of $250,000 account balance) | MySuper | 0.18% | 0.29% | |
| Non-platform TDPs | 0.21% | 0.29% | ||
| Platform TDPs | 0.38% | 0.53% | ||
| Multi-sector, non-platform, EDPs | 0.35% | 0.60% | ||
The CPPP does not provide any colour graduation for the total fees and costs charged, in recognition that these metrics may be significantly affected by different investment approaches and strategies with different levels of investment fees and costs. Investment fees and costs are already assessed in the Net Investment Return metric in the investment performance section of the CPPP.
6.2 MySuper lifecycle strategies
Assessing the fees and costs for lifecycle products is complex due to different fees and costs charged at the lifestage level. As administration fees are typically consistent across lifestages, the CPPP adopts a simplified approach and assesses the product-level administration fee as the administration fee sourced from the lifestage with the highest fee value after summing the four fee quarter values together. The CPPP assesses the product-level total fees and costs by asset-weighting the lifestages on a quarterly basis with the quarterly weighted numbers being summed to calculate the annual total fees and costs.
These steps allow for a more comparable product-level assessment of the member’s fees and costs experience between single-strategy and lifecycle products. The CPPP displays the product level assessment using a colour overlay.
6.3 Combining fees and costs charged across investment options over time
Where a MySuper product or investment option has had a change in structure, an authorisation change or transfer of members to an different product or option over time, APRA may combine the fees and costs before the change with the fees and costs after the change to achieve a full year of fees and costs. This may occur in two different situations:
- Within-product changes: where there have been changes to the structure or nature of the product/investment option (for example, single strategy to lifecycle) but the product/investment option continues (typically under an existing MySuper authorisation).
- Across-product changes: where a product/investment option has ceased and members have been transferred into a new product/investment option.
APRA has developed a number of principles and a methodology for combining the returns of multiple products over time which have been published in a MySuper Information Paper9 and a TDP Information Paper10on APRA’s website. Where there are multiple investment pathways prior to the change being mapped to a singular pathway post the change, the pathways are only stitched if all previous pathways had the same fee value.
Appendix A – CPPP metrics
| Metric | Formula | Purpose |
|---|---|---|
Performance Test Metrics | ||
Performance Test metric Performance Test result Actual return minus benchmark return Representative administration fees and expenses (RAFE) Relevant benchmark representative administration fees and expenses (BRAFE) | The methodology used to derive the legislated performance assessment metrics and results is contained in Section 9AB of the SIS Regulations: Federal Register of Legislation - Superannuation Industry (Supervision) Regulations 1994 | The annual performance assessment sets a clear, legislated performance benchmark that superannuation products are required to meet or otherwise face specific legislated consequences. The assessment incorporates investment performance and administration fees. |
Investment Return MetricsNet investment returns or gross investment return net of fees are sourced from SRS 705.1 Investment Performance and Objectives, Table 2. These values are taken from the Return Measurement Comparison Percent field under the corresponding Return Measurement Comparison Type. Net returns after 31 March 2021 are derived from data under SRS 705.0 Components of net return, Table 1. Net returns up to 31 March 2021 are derived from data under two standards:
The derivation of net returns up to 31 March 2021 is calculated as (1) – (2). Where gross investment return net of fees has been reported instead of net investment returns, the derivation net returns is as follows:
Where an investment option began on a day that is not the start of a quarter, or if the exact start date within the initial quarter for which data has been provided is not clear, then return metrics have been calculated based on the first full quarter of data that is clearly available.
| ||
| Net investment return / Gross investment return net of fees p.a. | 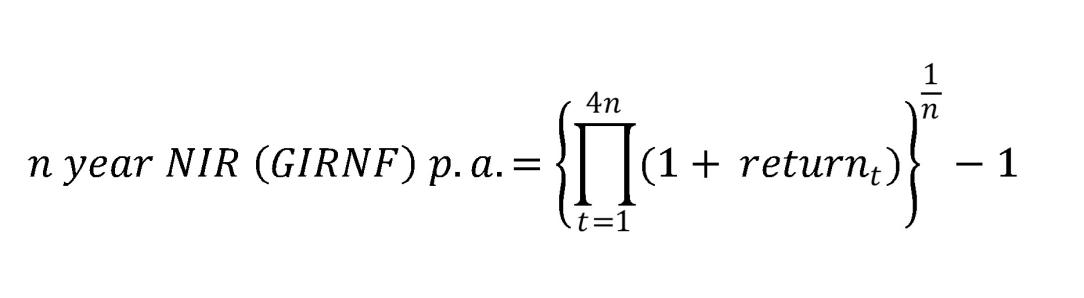 Where returnt is the quarterly Net Investment Return / Gross investment return net of fees for quarter t and n is either 3 years, 5 years, 7 years or 10 years | Return of the investment option after investment-related fees, costs and taxes have been deducted. |
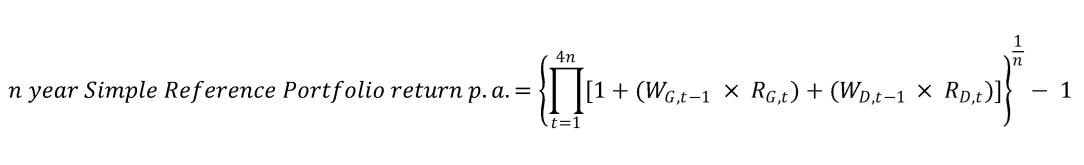
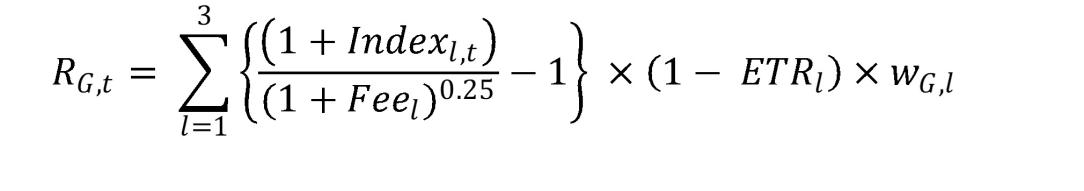
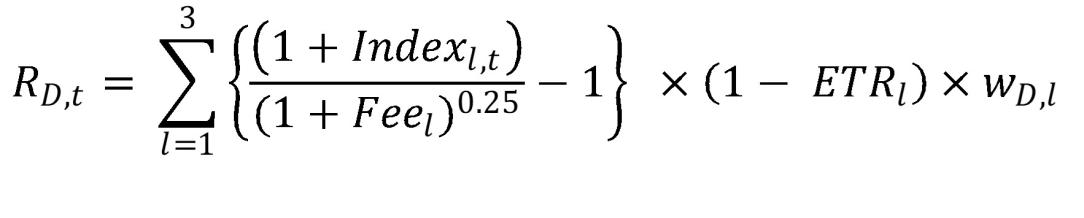
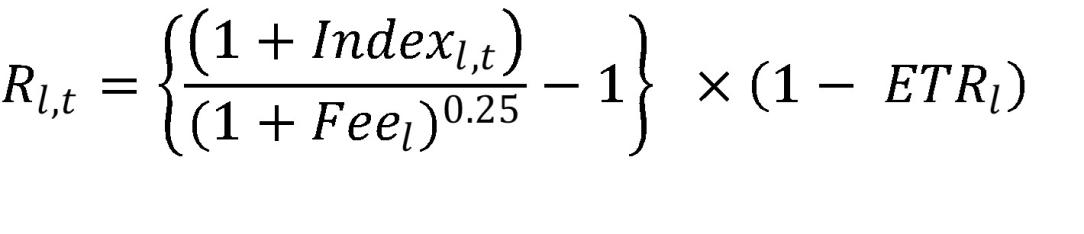
| Net investment return / Gross investment return net of fees relative to SRP p.a. |  where
W_(G,t-1)and W_(D,t-1 )are the investment option’s strategic allocation to growth and defensive assets at end of quarter t -1 (or start of quarter t); The SRP assumes rebalancing on a quarterly basis. The return on the growth portfolio is calculated as:
Index_(l,t) is the quarterly return on the index chosen to reflect asset class l for quarter t; The return on the defensive portfolio is calculated as:
Index_(l,t) is the quarterly return on the index chosen to reflect asset class l for quarter t; | This metric creates a bespoke reference portfolio for the product based on its allocation to growth assets (based on a consistent definition). The reference portfolio is a notional, simple, low cost portfolio consisting only of equities, bonds and cash. |
| Net Investment Return / Gross investment return net of fees relative to SAA benchmark portfolio p.a. | Performance relative to SAA benchmark portfolio= n year NIR (GIRNF ) p.a.- n year SAA benchmark portfolio return p.a. where
SAA_(l,t-1) is the strategic asset allocation to asset class l at end of quarter t -1 (or start of quarter t);
Index_(l,t) is the quarterly return on the index chosen to reflect asset class l for quarter t; | This metric assesses the value added through an RSE licensee’s implementation of the SAA relative to asset class benchmarks. |
| Net return p.a. (MySuper only) | 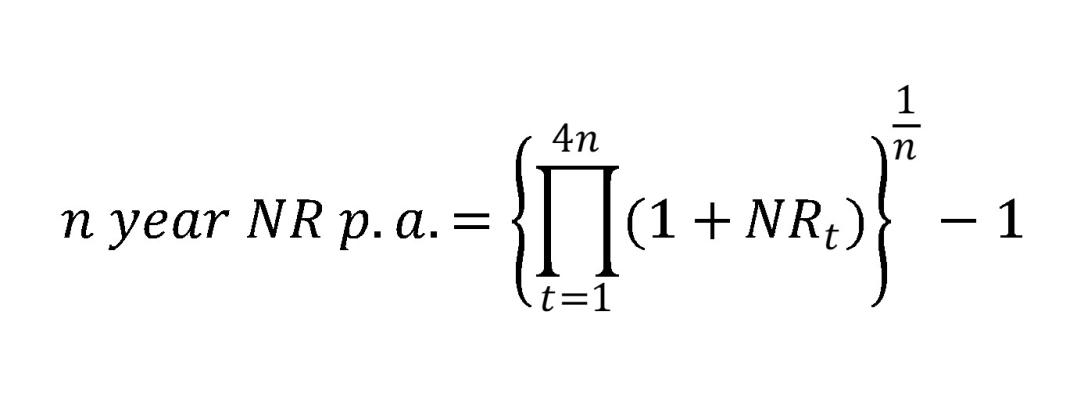 Where NRt is the quarterly Net Return for quarter t and n is either 3 years, 5 years, 7 years or 10 years | Return of the product/lifecycle stage after all fees, costs and taxes have been deducted for the $50,000 representative member. |
Fees and Costs MetricsThe components used to calculate Fees and Costs metrics are sourced from Table 1 of SRS 705.0 Components of Net Return as at 30 June. RG97 compliance is sourced from SRS 605.0 RSE Structure. Administration fees and costs metrics include both Administration and Advice fees and costs. Total fees and costs metrics include fees and costs across Administration, Advice, Investment and Transaction. All fee and costs metrics are net of tax. Any tiering of fees and costs is incorporated the calculation of metrics below. | ||
| Administration fees and costs (% of account balance) | 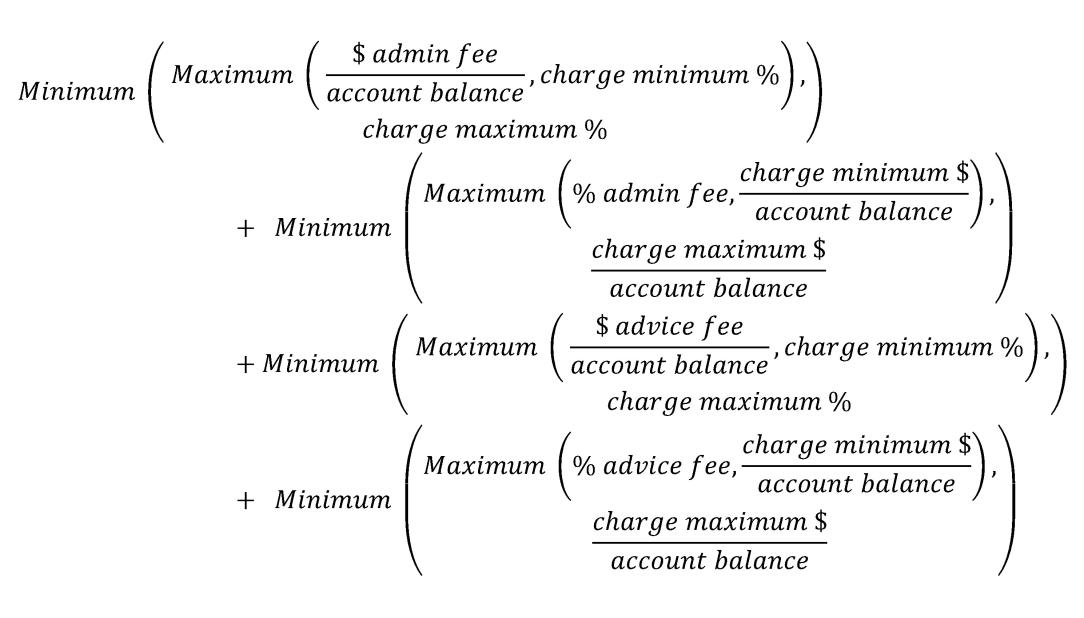 | To assess the impact of administration and advice fees and costs charged to members with a specific account balance in an investment pathway. |
| Total fees and costs | Administration fees and costs (% of account balance) + Transaction costs (% of account balance) + Investment fees and costs (% of account balance).11
| To assess the impact of fees and costs charged to members with a specific account balance in an investment pathway. |
![n year SAA benchmark portfolio return p.a.= [∏_(t=1)^4n▒(1+∑_(l=1)^A▒(〖SAA〗_(l,t-1)×R_(l,t) ) ) ]^(1/n)-1](/sites/default/files/styles/embedded_image/public/2024-09/f3.2.jpg?itok=rU1WtfGM)
Appendix B – Investment Indices
The following indices12 were used when creating the reference and benchmark portfolios:
| Asset Class | Index | Fee Assumption | Assumed effective tax rate |
|---|---|---|---|
| Australian Equity | ASA52 S&P/ASX 300 Total Return Index | 0.05% | 0.00% |
| International Equity (hedged; international economy type not specified or not applicable) | DE725341 MSCI All Country World Ex‑Australia Equities Index with Special Tax (100% hedged to AUD) | 0.11% | 14.00% |
| International Equity (hedged; emerging markets) | DA725342 MSCI Emerging Markets with Special Tax (100% hedged to AUD) | 0.16% | 14.00% |
| International Equity (hedged; developed markets) | DA750700 MSCI World ex Australia with Special Tax (100% hedged to AUD) | 0.10% | 14.00% |
| International Equity (unhedged; international economy type not specified or not applicable) | DN714533 MSCI All Country World Ex‑Australia Equities Index with Special Tax (unhedged in AUD) | 0.09% | 14.00% |
| International Equity (unhedged; emerging markets) | NA714531 MSCI Emerging Markets with Special Tax (unhedged in AUD) | 0.14% | 14.00% |
| International Equity (unhedged; developed markets) | NA714532 MSCI World ex Australia with Special Tax (unhedged in AUD) | 0.08% | 14.00% |
| Australian Listed Property | ASA6PROP S&P/ASX 300 A‑REIT Total Return Index | 0.12% | 14.00% |
| International Listed Property | RAHRSAH FTSE EPRA Nareit Developed ex Aus Rental 100% Hedged to AUD Net Tax (Super) Index | 0.22% | 14.00% |
| Australian Listed Infrastructure | FDCICSAH FTSE Developed Core Infrastructure 50/50 100% Hedged to AUD Net Tax (Super) Index | 0.26% | 14.00% |
| International Listed Infrastructure | FDCICSAH FTSE Developed Core Infrastructure 50/50 100% Hedged to AUD Net Tax (Super) Index | 0.26% | 14.00% |
| Australian Unlisted Property | MSCI/Mercer Australia Core Wholesale Monthly Property Fund Index – NAV‑Weighted Post‑Fee Total Return (All Funds) | 0% | 14.00% |
| International Unlisted Property | MSCI Global (Excl. Pan‑Europe and Pan‑Asia Funds) Quarterly Property Fund Index (Unfrozen) (Net Total Return; AUD fixed) | 0% | 14.00% |
Australian Unlisted Infrastructure
| MSCI Australia Quarterly Private Infrastructure Fund Index (Unfrozen) – 50th Percentile Post‑Fee Total Return (All Funds) | 0% | 14.00% |
| International Unlisted Infrastructure | MSCI Australia Quarterly Private Infrastructure Fund Index (Unfrozen) – 50th Percentile Post‑Fee Total Return (All Funds) | 0% | 14.00% |
| Australian Fixed Income | BACM0 Bloomberg Ausbond Composite 0+ Yr Index | 0.10% | 15.00% |
| Australian Fixed Income Excluding Credit | BAGV0 Bloomberg Ausbond Govt 0+ Yr Index | 0.08% | 15.00% |
| Australian Credit | BACR0 Bloomberg Ausbond Credit 0+ Yr Index | 0.15% | 15.00% |
| International Fixed Income | LEGATRAH Bloomberg Global Aggregate Index (hedged AUD) | 0.10% | 15.00% |
| International Fixed Income Excluding Credit | BTSYTRAH Bloomberg Global Treasury Index (hedged AUD) | 0.08% | 15.00% |
| International Credit | LGCPTRAH Bloomberg Global Aggregate Corporate Index (hedged AUD) | 0.15% | 15.00% |
| Australian Cash | BAUBIL Bloomberg Ausbond Bank Bill Index | 0.04% | 15.00% |
| International Cash | BAUBIL Bloomberg Ausbond Bank Bill Index | 0.04% | 15.00% |
| Alternatives | 25% International Equity (hedged; international economy type not applicable), 25% International Equity (unhedged; international economy type not applicable), 50% International Fixed Income | As per the underlying asset classes
| |
| Defensive Alternatives | 12.5% International Equity (hedged; international economy type not applicable), 12.5% International Equity (unhedged; international economy type not applicable), 75% International Fixed Income | As per the underlying asset classes
| |
| Growth Alternatives | 37.5% International Equity (hedged; international economy type not applicable), 37.5% International Equity (unhedged; international economy type not applicable), 25% International Fixed Income | As per the underlying asset classes
| |
For investment options that report Gross Investment Return Net of Fees, the tax rates assumed for all indices (including the composite alternative indices) are 0%.
The benchmarks chosen are considered to be representative of the investable market for an Australian superannuation investor. Total return indices (that is, returns inclusive of dividends as well as capital gains) have been used.
Index provider acknowledgements
Source: “Bloomberg®”, Bloomberg Ausbond Bank Bill Index, Bloomberg Ausbond Composite 0+ Index, Bloomberg Global Aggregate Index (hedged in AUD), Bloomberg Ausbond Govt 0+ Yr Index, Bloomberg Ausbond Credit 0+ Yr Index, Bloomberg Global Treasury Index (hedged AUD) and Bloomberg Global Aggregate Corporate Index (hedged AUD) are service marks of Bloomberg Finance L.P. and its affiliates, including Bloomberg Index Services Limited (“BISL”), the administrator of the index (collectively, “Bloomberg”) and have been licensed for use for certain purposes by APRA. Bloomberg is not affiliated with APRA and Bloomberg does not approve, endorse, review, or recommend APRA’s publications. Bloomberg does not guarantee the timeliness, accurateness, or completeness of any data or information relating to APRA’s publications.
Source: London Stock Exchange Group plc and its group undertakings (collectively, the “LSE Group”). © LSE Group 2024. FTSE Russell is a trading name of certain of the LSE Group companies. “FTSE®” “Russell®”, “FTSE Russell®”, are trade marks of the relevant LSE Group companies and are used by any other LSE Group company under license. All rights in the FTSE Russell indexes or data vest in the relevant LSE Group company which owns the index or the data. Neither LSE Group nor its licensors accept any liability for any errors or omissions in the indexes or data and no party may rely on any indexes or data contained in this communication. No further distribution of data from the LSE Group is permitted without the relevant LSE Group company’s express written consent. The LSE Group does not promote, sponsor or endorse the content of this communication.
Source: London Stock Exchange Group plc and its group undertakings, including FTSE International Limited (collectively, the “LSE Group”), European Public Real Estate Association ("EPRA”), and the National Association of Real Estate Investments Trusts (“Nareit”) (and together the “Licensor Parties”). © LSE Group 2024. FTSE Russell is a trading name of certain LSE Group companies. “FTSE®” and “Russell®” are a trade mark(s) of the relevant LSE Group companies and are used by any other LSE Group company under license. “Nareit®” is a trade mark of Nareit, "EPRA®" is a trade mark of EPRA and all are used by the LSE Group under license. All rights in the FTSE Developed Core Infrastructure and FTSE EPRA Nareit Global Real Estate indexes or data vest in the Licensor Parties. The Licensor Parties do not accept any liability for any errors or omissions in the indexes or data and no party may rely on any indexes or data contained in this communication. No further distribution of data from the LSE Group is permitted without the relevant LSE Group company’s express written consent. The Licensor Parties do not promote, sponsor or endorse the content of this communication.
Source: S&P Dow Jones Indices LLC, as of 16 August 2024. The S&P/ASX 300 Total Return Index and S&P/ASX 300 A-REIT Total Return Index are products of S&P Dow Jones Indices LLC or its affiliates (“SPDJI”) and ASX Operations Pty Ltd., and has been licensed for use by the Australian Prudential Regulation Authority (“APRA”). Standard & Poor’s® and S&P® are registered trademarks of Standard & Poor’s Financial Services LLC (“S&P”); Dow Jones® is a registered trademark of Dow Jones Trademark Holdings LLC (“Dow Jones”); ASX® are trademarks of the ASX Operations Pty Ltd. and these trademarks have been licensed for use by SPDJI and sublicensed for certain purposes by APRA. APRA’s publications are not sponsored, endorsed, sold or promoted by S&P DJI, Dow Jones, S&P, their respective affiliates, or ASX Operations Pty Ltd. and none of such parties make any representation regarding the advisability of investing in such product(s) nor do they have any liability for any errors, omissions, or interruptions of the S&P/ASX 300 Index and S&P/ASX 300 A-REIT Index.
Source: The blended returns are calculated by APRA using end of reporting period index level values licensed from MSCI (“MSCI Data”). For the avoidance of doubt, MSCI is not the benchmark “administrator” for, or a “contributor”, “submitter” or “supervised contributor” to, the blended returns, and the MSCI Data is not considered a “contribution” or “submission” in relation to the blended returns, as those terms may be defined in any rules, laws, regulations, legislation or international standards. MSCI Data is provided “AS IS” without warranty or liability and no copying or distribution is permitted. MSCI does not make any representation regarding the advisability of any investment or strategy and does not sponsor, promote, issue, sell or otherwise recommend or endorse any investment or strategy, including any financial products or strategies based on, tracking or otherwise utilizing any MSCI Data, models, analytics or other materials or information.
Footnotes
1Useful information for consumers seeking to better understand superannuation can be found on the Australian Securities and Investments Commission’s MoneySmart website.
ATO's YourSuper comparison tool provides information for consumers to help compare MySuper products. The comparison tool also shows each product’s performance under the annual performance assessment, including which products have failed this assessment.
2SRS 605.0 RSE Structure also allows for different Fees And Costs Arrangements to apply to members. The CPPP selects the “Standard” Fees and Costs Arrangement Type for each investment pathway. Adjustments are made where entities have reported more than one Fees And Costs Arrangement Type as Standard. APRA has chosen the lowest quarterly net investment return reported among the multiple arrangements for investment metrics, and the arrangement that results in the highest total fees and costs charged for a $50,000 balance for fees and costs metrics.
3Trustee Directed Products are defined in regulation 9AB.2 of the SIS Regulations.
4Net Investment Return is used to assess the performance of MySuper products, non-platform TDPs and multi-sector, non-platform, EDPs. Gross Investment Return Net of Fees is used to assess the performance of platform TDPs.
5Gross Investment Return Net of Fees is used to demonstrate the performance of platform investment options. Net Investment Return is used to demonstrate the performance of all other investment options.
6This methodology is consistent with the lifestage weight methodology in the regulations covering the annual performance assessment.
8Information paper: Combining trustee-directed product performance histories – APRA’s approach April 2023 | APRA
10Information paper: Combining trustee-directed product performance histories – APRA’s approach April 2023 | APRA
11Transaction costs (% of account balance) and Investment fees and costs (% of account balance) are calculated in the same manner as Administration fees and costs (% of account balance).
12Indices will be reviewed on a regular basis for appropriateness.