Climate Risk Self-Assessment Survey 2024
1. Executive Summary
APRA’s core purpose is to ensure that, under all reasonable circumstances, financial promises made by APRA-regulated entities are met within a stable, efficient and competitive financial system. For climate risk, APRA seeks to ensure that regulated entities manage climate risks prudently and effectively.
Understanding of the impacts of climate change and associated risk continues to grow across the financial sector globally and within Australia. There is increasing community awareness and expectation that financial sector entities will effectively manage risks associated with the changing climate. Recent regulatory focus on greenwashing has brought attention to public disclosure of climate-related information by organisations. In this context, leading practice on managing climate risk continues to evolve.
The Climate Risk Self-Assessment Survey was carried out to provide a better understanding of the alignment of entities’ practices with APRA’s guidance on climate risk. The survey assesses climate risk-related practice across four topic areas: governance and strategy, risk management, metrics and targets, and disclosure. For the 2024 survey, APRA invited participation on a voluntary basis by regulated entities across banks, insurers (including general, private health and life insurers, and reinsurers) and superannuation trustees.
APRA received 149 responses to the survey, covering over half of the regulated entities in scope. The self-assessment results were broadly aligned with APRA’s expectations, taking into account the varying size and complexity of respondent entities. Larger entities showed an overall increase in climate risk maturity since the 2022 survey, but significant variation between entities remains. This indicates scope for further convergence towards leading practice. Smaller entities reported lower maturity on average.
Entities, including those who did not respond to the survey, should consider the findings, reflect on their own preparedness and implement leading practice for managing climate risk. Stakeholder expectations on climate risk management are rising, and APRA is committed to ensuring that the institutions it regulates take a strategic and risk-based approach to managing climate-related risks in a proportionate manner.
Further key insights from the survey include:
- Most large entities have improved their climate risk maturity since 2022.
- However, around one-quarter of large entities have seen their overall climate risk maturity decline since 2022, with a drop in self-assessed disclosure maturity a key contributing factor.
- However, around one-quarter of large entities have seen their overall climate risk maturity decline since 2022, with a drop in self-assessed disclosure maturity a key contributing factor.
- The average level of climate risk maturity of large banks has improved since 2022.
- For insurance and superannuation entities, maturity is broadly unchanged.
- For insurance and superannuation entities, maturity is broadly unchanged.
- Within the insurance industry, there is a large difference in climate risk maturity across the general, life and private health cohorts.
- Climate governance and strategy, and climate risk management, are two areas of comparative strength across most industries and the different tier groups.
- Entities on average showed slightly lower maturity for climate risk disclosure in 2024, despite this being the most advanced area in 2022. This change may reflect a reassessment by survey respondents of expectations for mature disclosure practice rather than a deterioration in practice.
- More mature governance structures are typically in place at entities where climate risk has been integrated into risk management.
- Entities are starting to consider adjacent risks and practices such as nature risk and transition plans.
Next steps
As signalled in the 2024-25 Corporate Plan, APRA continues to lift its expectations for entities in considering climate-related financial risks in their decision-making. Building on the survey’s insights, APRA will undertake a range of activities to elevate consideration of climate risk within the regulatory and supervisory landscape, including:
- Commencing consultation in 2025 on amending prudential standards CPS 220 and SPS 220 Risk Management to include climate risk. This follows informal industry engagement that APRA has been conducting on appropriate next steps for further embedding climate risk considerations in the prudential framework.
- Continuing work to understand how APRA can best incorporate climate risk within its broader supervision framework. This includes training and improved support on climate risk for APRA’s supervisors.
2. Introduction
Climate change presents risks to the financial system and the APRA-regulated entities that operate within it. This includes physical, transition, and liability risks which are collectively referred to as climate risks in this Information Paper.
APRA considers climate risks through the lens of the potential impact on the financial system’s safety and soundness, in particular, how climate risk may impact the ability of entities to meet financial promises. A key focus for APRA is ensuring that entities take a strategic, proportionate and risk-based approach to managing climate risks.
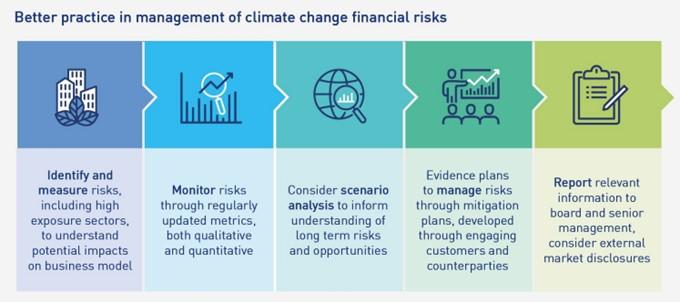
To assist entities and provide guidance on addressing climate risk, in 2021 APRA published Prudential Practice Guide - Climate Change Financial Risks (CPG 229), key elements of the guidance are summarised in Figure 1. By adopting these prudent practices, entities can better manage the risks associated with climate change. This in turn contributes to maintaining a safe and resilient financial system.
APRA conducted its first Climate Risk Self-Assessment Survey in 2022 to provide insights on how large entities were managing climate risks, using CPG 229 as a benchmark. Insights from the 2022 survey were published in an Information Paper1in August 2022.
Building on this, APRA launched a follow-on survey in April 2024 to refresh understanding of climate risk management practices across banking, insurance and superannuation entities. This Information Paper sets out insights based on the 2024 survey (self-assessed) responses.
Figure 1: Better practice in the management of climate-related financial risks
Survey participation and response rates
APRA regulates a large range of financial entities of varied business models, sizes, and complexities. APRA took a proportionate approach to the first climate risk survey in 2022, limiting voluntary participation to entities of higher systemic importance (Tiers 1 and 2).2 This year, to gain a broader understanding of CPG 229 alignment across the financial industry, APRA invited participation from Tiers 1 to 4 across banks, insurers (including general, private health and life insurers as well as reinsurers), and superannuation trustees.
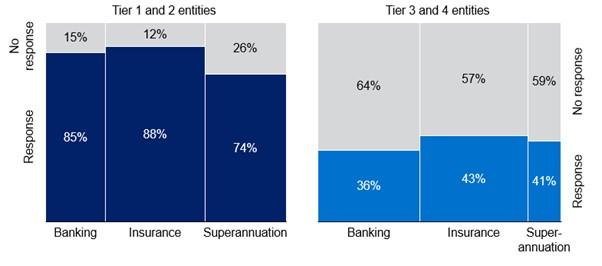
APRA received 149 responses to the 2024 survey. While most responses related to a single entity, some group-level submissions covering a number of entities were also received. Overall, the responses and submissions represent more than half of the entities in scope. The response rate was higher among the larger, more complex Tier 1 and Tier 2 entities than Tier 3 and Tier 4 entities (Figure 2). The lower response rate of smaller Tier 3 and 4 entries was expected: some smaller entities may not have the resources to provide a response, particularly on a risk area where they are still developing their approach.
As participation in the survey was voluntary it is possible responses received were from those entities that are more progressed on climate risk management. This may contribute to a positive bias in the self-assessed responses. Further, APRA has not validated the self-assessment responses: the results presented are based on the surveys as completed. This is consistent with the 2022 survey.
This Information Paper presents data and insights based both on the proportion of responses received, and with a weighting by size of the entities. Where the data include responses from Tier 1 to 4 entities, the charts are not directly comparable to those published in the 2022 Information Paper (as the 2022 survey was limited to Tier 1 and 2 entities). Additionally, some survey questions were optional for Tier 3 and 4 entities: the report indicates where the analysis is based on a smaller set of survey responses.
Figure 2: 2024 Survey response rates, by industry and tier3
3. Overview and key insights
The 2024 survey provides up-to-date insights on how entities are governing, managing, measuring, and disclosing climate risks. This chapter sets out the key insights, together with comparisons with the 2022 survey results (for Tier 1 and 2 entities). Additional detail and data are presented in Appendix A – Detailed survey findings. These findings provide a point-in-time self-assessment of performance on climate risk practices across: governance and strategy, risk management, metrics and targets, and disclosure.
3.1 Key Insights
Most large4 entities have improved their climate risk maturity since 2022. However, around one-quarter of large, high performing5 entities have seen their climate risk maturity decline.
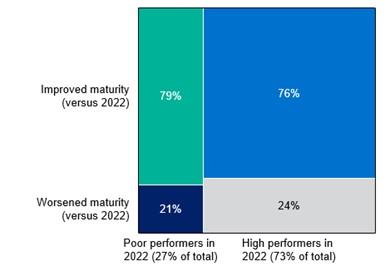
Overall, a clear majority of large entities have shown improvement in their climate risk maturity6 in the 2024 survey (relative to the 2022 survey). Over three quarters of large entities improved their maturity, irrespective of whether they were high or poor performers in 2022. Conversely, around one quarter (24%) of high performing and 21 percent of poor performing entities in 2022 have shown a decline in their climate risk maturity in 2024 (Figure 3).
The most common driver of declining climate risk maturity was entities self-reporting lower disclosure maturity, followed by metrics and targets. The regulatory and standard-setting landscape for disclosure is rapidly evolving and entities may have slowed the development of their climate disclosure capabilities over the last two years as they seek to better understand this evolving landscape before investing in capability growth. The decline may also reflect a reassessment by entities of what constitutes mature disclosure practice.
Figure 3: Change in climate risk maturity of Tier 1 and Tier 2 entities, 2024 versus 2022
The average climate risk maturity of large banks has improved since 2022, while average maturity for insurance and superannuation entities is broadly unchanged
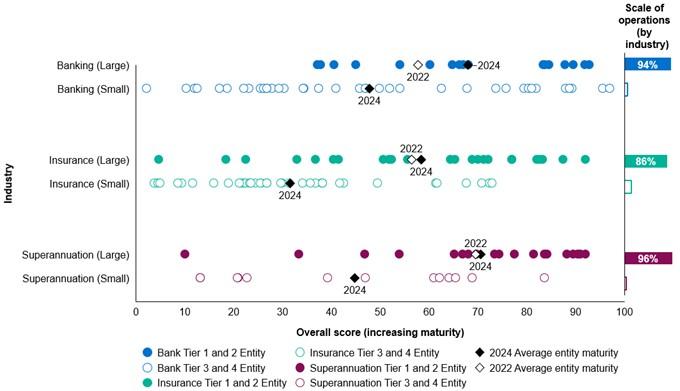
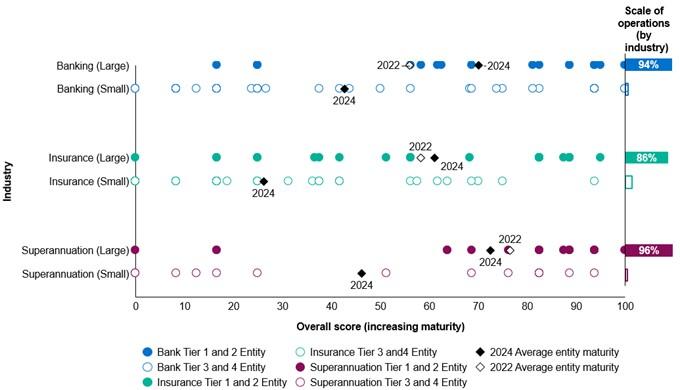
The average climate risk maturity score for large banks was 18 percent higher in 2024 than the comparable 2022 score, indicating a significant improvement in the banking industry’s overall climate risk maturity (Figure 4). In contrast, the average climate risk maturity scores for large insurance and superannuation entities remained largely unchanged, increasing 3.5 percent and 1.4 percent respectively. Despite showing the weakest rate of improvement, superannuation remained on average the highest performing industry, marginally outperforming banks and exceeding the insurance industry’s average performance by around 12 percentage points. The main driver was higher risk management maturity by large superannuation trustees. Further details are provided in Appendix A.
Within each industry, climate risk maturity scores spanned a wide range. Banks have the greatest range, with the lowest maturity score at 2 (out of 100) and the highest at 97 (out of 100), a range of 95 points. For insurance and superannuation, the range between the lowest and highest scoring entities is 88 points and 82 points, respectively. A further breakdown of insurance scores by general insurance, reinsurance, life insurance, and private health insurance is provided in Figure 7.
When considering only large entities, the highest to lowest bank maturity scores spanned a smaller range (55 points), compared to insurance and superannuation entities.
Figure 4: Entity climate risk maturity by industry, size (tier), and scale of operations7
‘Governance and strategy’ and ‘risk management’ are areas of comparative strength across most industries and tier groups
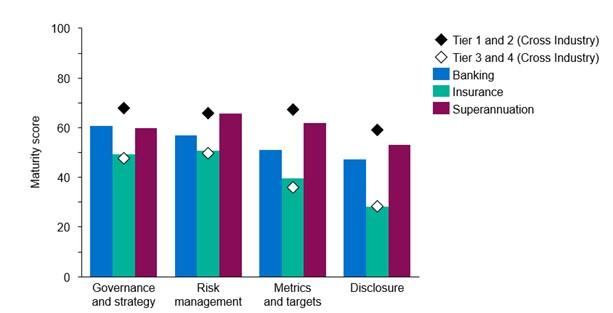
Governance and strategy, and risk management, are two areas in relation to climate risk where entities reported reasonable alignment with CPG 229. The maturity of banking and insurance entities was higher on average in these two areas than it was for metrics and targets, or for disclosure (Figure 5). Across all industry groups, smaller entities also reported higher maturity in these two areas. However, superannuation trustees on average have a higher maturity on metrics and targets than for governance and strategy.
In general, governance and strategy and risk management (as set out in CPG 229) primarily involve having structures and practices in place that promote mature climate risk management. Entities are possibly progressing on addressing climate risk by first implementing these structural controls, while the development of tools to fully embed climate risk – such as metrics to use for measurement, or disclosure for communication – are less developed.
While risk management is an area of strength, there is still more to do. The survey results reveal climate risks are far from being fully embedded across risk management frameworks (Figure 19), which is a critical step where a risk is considered material.
Figure 5: Maturity scores for CPG 229 sections by industry (by count of industry respondents)
Entities reported lower maturity in climate risk disclosure, despite this being the most mature area in 2022
Disclosure serves to enhance market transparency and confidence that an entity is effectively measuring and managing its climate-related risks. In the 2024 survey, entities showed a lower level of alignment with APRA’s guidance on disclosure compared to the 2022 survey findings, despite increasing stakeholder demand for more reliable and timely disclosures (Figure 5). In the 2022 survey, disclosure was the area of highest maturity among large entities, in 2024 it is the lowest. Importantly, this outcome is due to average improvement across all three other categories of CPG 229 – governance and strategy, risk management, metrics and targets – while progress on disclosure has largely stagnated.
The regulatory and standard-setting environment for climate-related financial disclosure is also rapidly changing, including the passing of Australia’s first climate-related financial disclosure regime8 in Parliament in September 2024. Recent regulatory focus on greenwashing has concurrently brought attention to the public disclosure of climate-related information by organisations. Entities, particularly those with fewer available resources, may be waiting for further certainty in the regulatory and standard setting environment before investing in additional capabilities to support a public climate risk disclosure, contributing to the lack of improvement in the last two years. The mandatory climate-related financial disclosure regime is likely to accelerate progress in this area.
Larger entities are more progressed on their climate risk maturity than smaller entities, indicating that a significant portion of industry operations are covered by mature climate risk practice
Prudent entities would assess their exposure to climate risk and implement appropriate risk management practices. However, APRA expects the design of these practices to be proportionate to the size, complexity, critical activities, substitutability, interconnectedness and resolvability of an entity. The 2024 survey results suggest that the smaller, less systemically important entities have a lower climate risk maturity than their larger counterparts. While it is important for entities to identify and assess material climate risks for their business, the extent of this process and the subsequent risk management practices should be proportionate to the risks.
Leading practice in climate risk management is still evolving across the financial sector. APRA expects that larger, more systemically important entities to be among the first to help develop and adopt these practices as they have both the need and the resources to invest in climate risk maturity. It is therefore appropriate for the larger entities to be more mature than smaller entities at this stage. As understanding of leading practice continues to evolve, it is reasonable to expect smaller entities will also gradually improve their climate risk maturity, albeit in a manner proportionate to their size and complexity.
Some smaller entities, particularly banks and general insurers, will be exposed to unique climate risks due to the geographic or sectoral concentration of particular markets. This is an example of where identification and assessment of material climate risk is pertinent. In these circumstances, prudent governance, strategy, and risk management practices for climate risk should be well-embedded throughout the business to support its financial resilience in the short and longer term.
The investment by larger entities in climate risk management also creates the potential for further industry-wide improvement. For example, the investment by larger entities in data access and availability may lead to lower-cost access for smaller entities.
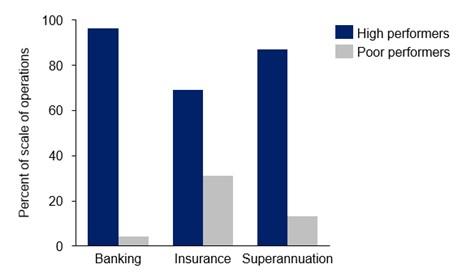
A minority of all entities were high performers (scored above 50 percent) on the overall climate risk maturity metric, although the scale of operations of those entities represents 96 percent of total assets managed by responding banks, 87 percent of total assets managed by responding superannuation trustees, and 69 percent of total revenue earned by responding insurers (Figure 6). From the perspective of system-level resilience to the impacts of climate risk, this is a positive finding. However, improving climate risk maturity remains a challenge for many entities.
Figure 6: Climate risk maturity by scale of operations
Within the insurance industry, there is a large difference in climate risk maturity across the general, life and private health insurance cohorts
While the survey results for insurance entities have been grouped together for the overall findings in this paper, different segments of the insurance industry - general insurers, private health insurers, and life insurers – have different direct and indirect exposures to climate risk.
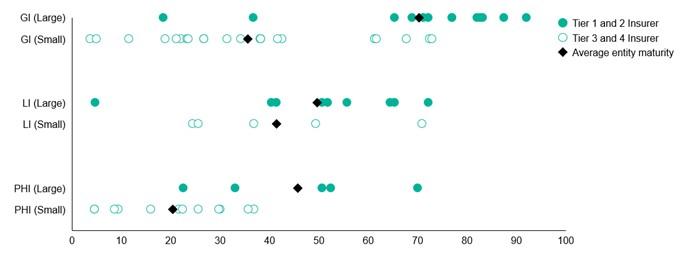
The survey results revealed material differences in climate risk maturity between general insurance (including reinsurance entities), life insurance, and private health insurance entities (Figure 7). While climate risk may impact both the underwriting (risk) and investment (capital) sides of insurance, for general insurers the connection between climate risk and their underwriting business is more apparent as weather events represent a material risk to insure against for home insurance. Consistent with the overall industry maturity scores and recognising our expectations based on a proportional approach, the climate risk maturity of smaller entities within an insurance cohort is typically below their larger counterparts. This difference is more material for general insurers, reinsurers, and private health insurers than it is for life insurers.
Further details and insurance segment results are included in Appendix A.
Figure 7: Insurance entity climate risk maturity scores, by insurance industry and size (tier)9
More mature governance structures are typically in place at entities where climate risk has been integrated into risk management
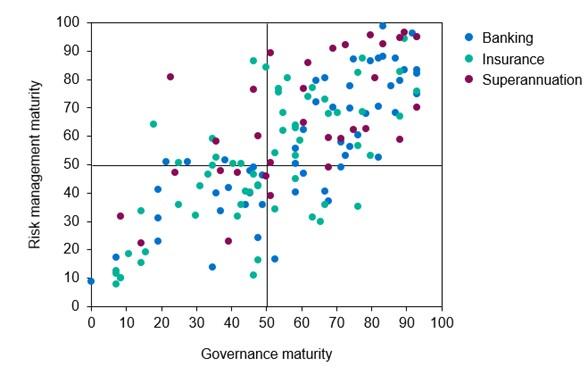
The survey results show that entities with more mature risk management also have more mature governance practices relating to climate risk (Figure 8). This does not imply that better risk management necessarily gives rise to better governance, or vice versa, but it illustrates the co-existence of mature practice across these two dimensions of CPG 229. Where entities include climate risk in their risk management framework, it provides a structure and a process for entities to identify and assess the materiality of climate risk to their business: this in turn can provide a basis for information to feed into the governance process.
Figure 8: Entity risk management maturity, ranked by governance and strategy maturity
Entities are starting to consider adjacent risks and practices such as nature risk and transition plans
While APRA has provided guidance to support its regulated entities as they build their climate risk capabilities, entities are also starting to consider related risks and practices such as nature risk10 and transition plans.11 CPG 229 does not provide guidance on transition plans or nature risk: however, the 2024 climate risk self-assessment survey included preliminary questions to gauge how entities are evolving their thinking when it comes to these emerging topics. This aligns with the Government’s Sustainable Finance Roadmap, in which supporting credible transition planning is a key priority. The roadmap also seeks to integrate nature-related financial risks into the broader approach to sustainable finance.
A credible transition plan can be an effective communication and strategy document for financial entities, as it links broader entity strategy and the management of climate risks. The survey results show that this is a fast-emerging practice, with over 30 percent of entities indicating that they have created a transition plan. A similar number of additional entities expect to publish a transition plan in the coming year. Almost all entities that have developed transition plans have Board oversight of climate risk and have set climate-related targets.
Oversight and consideration of nature risk is occurring in a small portion of the entities that responded to the survey. There are clear intersections between climate risk and nature risk, and for some entities many of the challenges are similar. Entities may be able to leverage the lessons learned through responding to climate risk to help inform the development of improved nature risk measurement and management.
Further details on nature risk and transition plans are included in Section 4.5.
3.2 Summary and next steps
This survey is a key source of information for APRA, entities, and the community, as it provides a point-in-time view of climate risk maturity across the banking, insurance and superannuation industries. While there has been progress on climate risk maturity, APRA notes that:
- A notable number of large entities performed worse in 2024, compared with 2022.
- There is a material difference in climate risk maturity between large and small entities.
Building on the insights from this survey, APRA will undertake a range of activities which will elevate climate risk within the regulatory and supervisory landscape, including:
- commencing consultation on amending prudential standards CPS 220 and SPS 220 Risk Management to include climate risk in 2025. This is as a follow up to the informal industry engagement APRA has been conducting with industry.
- Continuing work to understand how APRA can best incorporate climate risk within its broader supervision frameworks. This includes training and improved support on climate risk for APRA’s supervisors.
These activities will be complemented by APRA’s engagement with Council of Financial Regulator agencies, and alignment with the Government’s Sustainable Finance Roadmap.
4. Appendix A – Detailed survey findings
4.1 Governance and Strategy
APRA-regulated entities that responded to the survey generally reported effective climate risk governance and strategy practices. This suggests that Boards, and those with delegated responsibility, are well set up to oversee climate risk and to ensure it is well managed, both for the short-term and long-term, through strategic decisions. In 2024, banks scored highest on average for governance and strategy, followed by superannuation trustees and then insurance entities (Figure 9). The overall performance on governance and strategy is highly variable in entities of varying sizes and complexities, potentially reflecting the evolving nature and industry understanding of climate risk.
Figure 9: Entity maturity on governance and strategy by industry, size (tier), and scale of operations
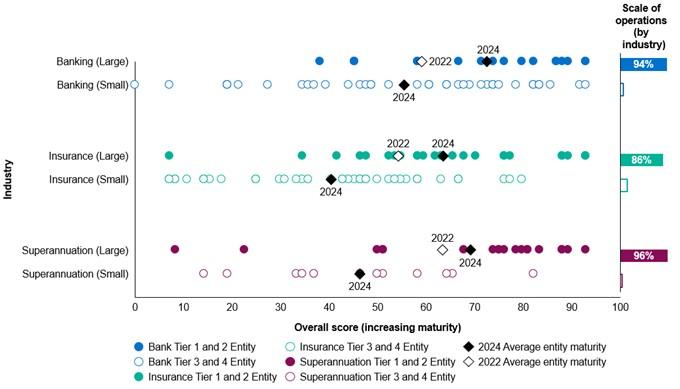
The key themes for responding entities, in governance and strategy, are:
- Almost all (97 percent) of boards oversee climate risk, with most boards by entity count providing regular oversight. This includes entities responsible for over 80 percent of operations by industry (Figure 10).
- Fewer than half of entities consider climate risk when appointing board members, fewer again (37 percent) have a current board member with experience or expertise in climate or ESG (Figure 11).
- Management of climate risk is delegated in three-quarters of entities, from the board to a senior manager or management committee.
- Respondents across all industries were more likely to have defined roles and responsibilities across their business lines (line 1), than for the independent risk management (line 2) and independent audit and assurance (line 3) (Figure 12).
- It is not common practice for entities to link senior leaders’ variable remuneration plans to climate-related targets, to provide an incentive structure, based on count of responding entities.
- Banks covering 90 percent of respondents operations have an incentive structure for at least some leaders, compared with only 30 percent of operations covered by superannuation trustees (Figure 13).
- Banks covering 90 percent of respondents operations have an incentive structure for at least some leaders, compared with only 30 percent of operations covered by superannuation trustees (Figure 13).
- Over two-thirds (70 percent) of boards have undergone climate risk training.
- While the majority of training at a staff-level has been focussed on a target group (Figure 14).
- While the majority of training at a staff-level has been focussed on a target group (Figure 14).
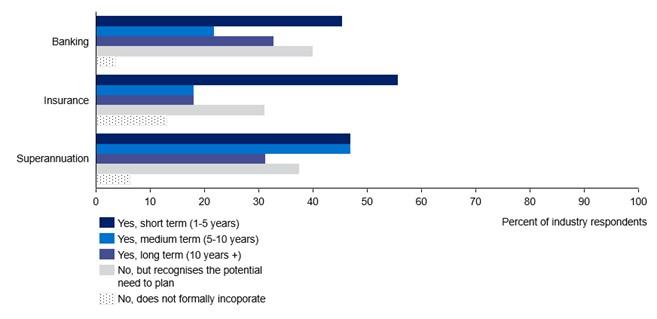
- Strategic planning incorporates climate risk, across at least one horizon, at 60 percent of responding entities. However, this still generally has maintained a focus on the short-term (1-5 years) strategic outlook (Figure 15).
Figure 10: Does your institution’s board or board committee oversee climate risk? (weighted by scale of operations)

Figure 11: Have there been any climate risk considerations in the composition of the board? (by count of industry respondents)

Figure 12: Does your institution clearly define the roles and responsibilities of business lines, and independent risk and assurance functions (i.e., first, second and third lines of defence) in relation to managing climate risks?12 (by count of industry respondents, per business line)
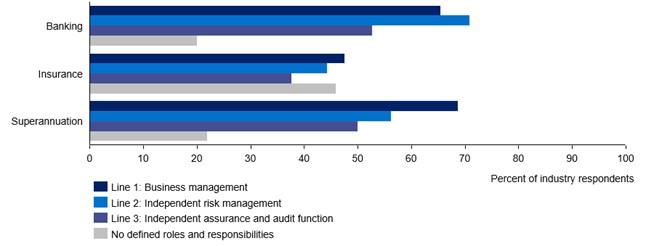
Figure 13: For members of the executive and/or senior leadership who participate in variable remuneration plans (incentives), are the awards linked to climate-related targets?13 (weighted by scale of operations)

Figure 14: Has your institution provided training in relation to climate risk to its staff? Please respond to this question in regards to your institution’s staff (other than the members of the board) (by count of industry respondents)

Figure 15: To what extent does your institution incorporate climate risks into its strategic planning process?14 (percentage by count of industry respondents)
4.2 Risk management
Risk management is a self-assessed area of strength for many entities. This suggests that respondents have invested in incorporating climate risk into their risk management frameworks, and that they understand how climate risk is positioned in relation to other risk types. However, there remain areas for better practice in alignment with APRA’s CPG 229 guidance, particularly in uplifting climate risk to be fully embedded (like other risk types) across their broader risk management framework.
Across all three industries, large entities reported improved climate risk management relative to their 2022 score (Figure 16). APRA expects that entities will continue to evolve and improve on this practice over time, and therefore should see this as an ongoing trend in future.
Figure 16: Entity maturity on risk management by industry, size (tier), and scale of operations
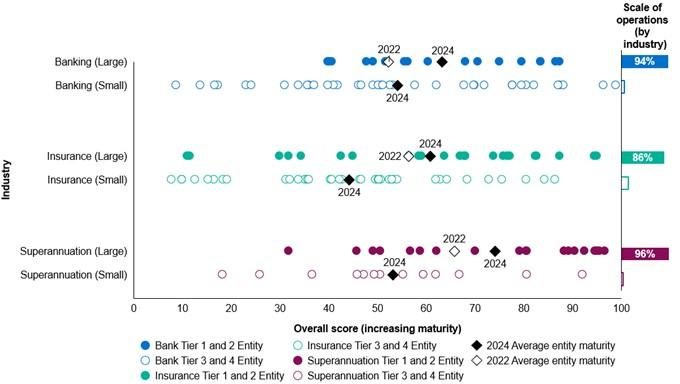
The key insights emerging from the results on risk management are as follows:
- Banking operations are nearly twice as likely as insurance and superannuation operations to be covered by a risk management framework that treats climate risk as a unique risk, and as a driver of other risks (Figure 17).
- Entities that consider climate risk as a driver of other risks most commonly see it as a driver of reputational risk, strategic and business planning risk, and credit risk.
- Entities that consider climate risk as a driver of other risks most commonly see it as a driver of reputational risk, strategic and business planning risk, and credit risk.
- Just over half of entities have considered liability risk, and another 17 percent expect to do so within the year (Figure 18).
- Climate risk is not ‘fully embedded’ across different elements of the risk management framework at most entities (Figure 19)
- Most entities (63 percent) have completed at least one scenario analysis (Figure 20), and most of these entities have analysed at least a high physical and a high transition risk scenario). The Intergovernmental Panel on Climate Change (IPCC) and the Network for Greening the Financial System (NGFS) are common sources for scenarios used by entities across the three industries.
- Entities most commonly self-assessed themselves to be “somewhat” vulnerable to both a high emission and a disorderly transition scenario (Figure 21).
- However, it is concerning that around one in six entities remain unsure of how vulnerable they would be to either of these scenarios.
- However, it is concerning that around one in six entities remain unsure of how vulnerable they would be to either of these scenarios.
- Seventy percent of responding insurance entities expect climate change to affect their underwriting business. This is particularly so for general insurers and reinsurers, with over 90 percent expecting an impact, compared to 50 percent or less of life and private health insurers (Figure 22). Of the insurers who expect an impact on their underwriting business, the following is observed:
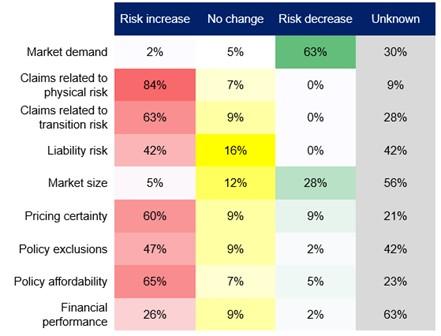
- Sixty-five percent expect policy affordability to decrease, and over half of these entities also expect that there will be more policy exclusions due to climate change (Figure 23).
- Six times as many insurers thought pricing risk15 would increase as those insurers who thought the risk would remain the same or decrease. A notable 21 percent consider the direction of change unknown.
- Over a quarter expect greater risk to financial performance due to climate change, despite over 60 percent expecting increased market demand.
- There are some areas where the expectation for increased risk is variable across insurance cohorts, notably:
- Risk to pricing certainty and policy exclusions are overwhelmingly expected by general insurers, compared with life and health insurers, of whom under a quarter expect these risks to increase.
- The claims burden from transition risk is expected to increase by a majority of private health insurers (86%), compared with a smaller proportion of life insurers (43%) and two-thirds (66%) of general insurers. This does not infer expectations about the magnitude of the change in claims burden.
- Private health insurers may expect transition risk-related claims to increase through a range of transmission channels. For example, the transition to a lower-emissions economy may lead to: increased employment uncertainty and in turn a higher incidence of mental health issues, or greater inflationary pressure in healthcare as a relatively high-emissions sector.
As a proportion, life insurers are most unsure about the impact of climate change on different factors of underwriting risk, while private health insurers have clearer expectations.
Figure 17: How are climate risks integrated into your institution’s overall risk management framework? (weighted by scale of operations)

Figure 18: Has your institution considered liability risk in relation to climate change? (by count of industry respondents)

Figure 19: Which of the following elements of your institution’s risk management framework specifically considers climate risks? (by count of total respondents)
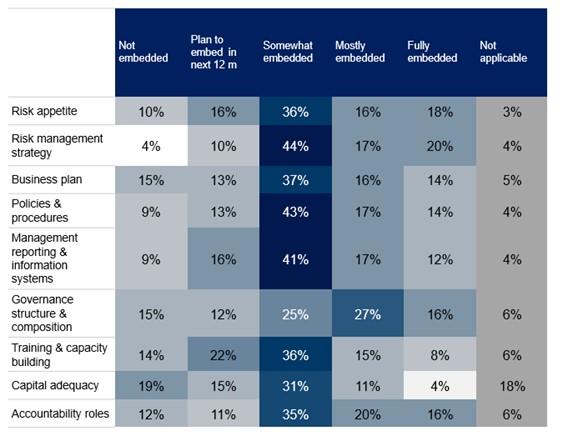
Figure 20: Has your institution undertaken climate-related scenario analysis? (by count of industry respondents)

Figure 21: Assuming no mitigating actions are taken, to what extent is your institution’s business model vulnerable to transition (physical) climate risks arising from climate change under a disorderly transition (high emissions) scenario?16 (by count of total respondents)
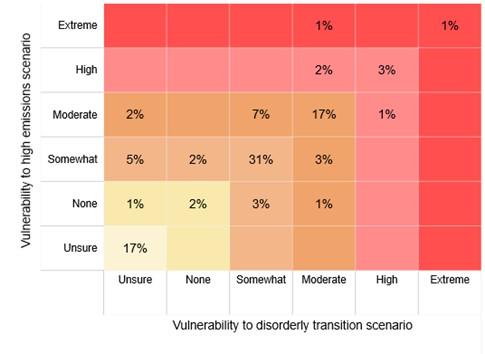
Figure 22: Does your institution expect climate-related risks to affect its underwriting business? (by count of respondents in industry lines17)

Figure 23: How does your institution expect climate-related risks to affect its underwriting business?18 (by count of responding insurers, who expect their underwriting business to be impacted by climate change)
4.3 Metrics and targets
The overall performance of large entities was significantly better for metrics and targets than that reported by smaller entities (Figure 24). Large banks showed a material improvement in maturity for metrics and targets compared to their 2022 score, while there was a small change for insurers and superannuation trustees. Quantitative data supported by qualitative information is best practice for measuring and monitoring climate risk: however, as APRA expects a proportional, risk-based approach, reliance on qualitative information may be more suitable for smaller entities.
Figure 24: Entity maturity on metrics and targets by industry, size (tier), and scale of operations19
The key findings for metrics and targets include:
- Fifty-seven percent of entities have developed some qualitative or quantitative metrics, with almost all of those entities including some quantitative metrics (Figure 25).
- Over half of banks and insurers do not have quantitative metrics to monitor climate risk, compared to 25 percent of superannuation trustees.
- Overall, just over 20 percent of entities still rely solely on either quantitative data or qualitative data particularly in the case of some insurance entities.
- Entities are using a wide range of data sources to develop their metrics.
- For those entities using quantitative data to support and inform their metrics, counterparty emissions data were the most common data relied on, followed by sector-level emissions estimates, and geographic and climate weather data.
- Qualitative data most tracked by entities is international and domestic policy changes to monitor climate risk.
- Scope 1, 2 and 3 emissions in the wholesale lending portfolio are measured across 64 percent of bank operations (Figure 26).
- Scope 1, 2 and 3 emissions are measured over a smaller volume of operations in superannuation investment portfolios (27%) and across insurance underwriting exposures (18%).
- Measurement of emissions associated with insurance underwriting, scaled by operations, is not common, with over half not measuring emissions across any scope.
- Over half (54 percent) of entities have set at least one climate-related target (Figure 27), with direct emissions and financed emissions targets the most common basis for target-setting.
- Some entities have regular reviews of their targets; however, this is not a common practice.
Entities indicated a variety of situations which can trigger a review of climate-related targets, including changes in scientific understanding of climate change, domestic and international regulatory conditions, business structure, and the operating environment.
Figure 25: Does your institution have metrics to measure and monitor climate risks? (by count of industry respondents)

Figure 26: Does your institution assess emissions arising from its wholesale lending / retail lending / investment assets / underwriting exposure? (weighted by scale of operations)

Figure 27: Has your institution set any climate-related targets for its activities?20 (by count of industry respondents)

4.4 Disclosure
The regulatory and standard-setting environment related to climate risk disclosure is evolving rapidly. When APRA conducted the 2022 survey, best practice was to align disclosures with the Task Force on Climate-related Financial Disclosures (TCFD) framework: this initiative has now been absorbed into the International Sustainability Standards Board’s (ISSB) S1 and S2 standards. Entities that will be captured under the mandatory climate disclosure regime will report under the Australian Sustainability Reporting Standards developed by the Australian Accounting Standards Board (AASB).
The changes in the regulatory environment may be contributing to variable entity disclosure maturity across all industries (Figure 28). The Government’s mandatory climate disclosure regime commences on 1 January 2025 and will initially apply to larger corporates: a significant number of APRA-regulated Tier 1 and 2 entities are included in this initial stage. This may be incentivising large entities to build capacity in this area, as well as respond to public pressure to disclose their approaches, compared to smaller Tier 3 and 4 entities. Large banks have improved their climate disclosure score, on average, in the last two years. Large insurance and superannuation entities have seen a comparative decline in their average disclosure maturity score, both down by around 10 points.
Figure 28: Entity maturity on disclosure by industry, size (tier), and scale of operations 21
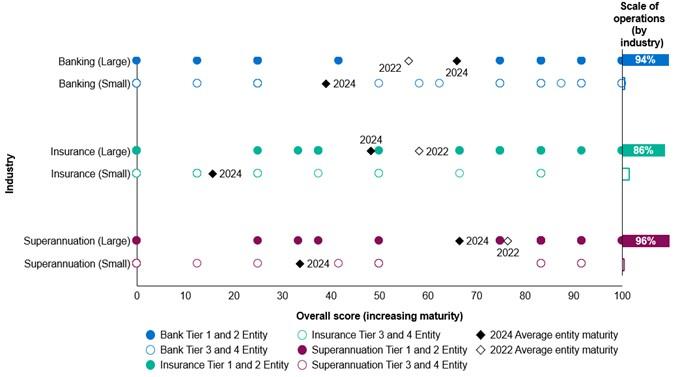
The key findings on disclosure, in the survey responses, include:
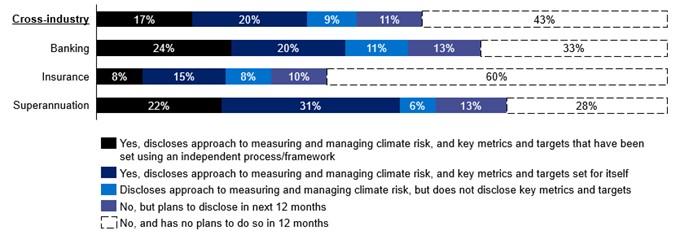
- Forty-six percent of entities have disclosed their approach to measuring and managing climate risk (Figure 29).
- Over three-quarters of entities who have made a public disclosure in the last year, have aligned the statement to the TCFD recommendations.
- Disclosure is expected to become more common practice, with an additional 11 percent of entities intending to disclose their approach to managing climate risk in the next 12 months (Figure 29).
- Climate targets, strategy, and direct emissions are common features in entities’ public disclosures.
Figure 29: Does your institution publicly disclose its approach to measuring and managing climate risks, including metrics and targets? (by count of industry respondents)
4.5 Nature risk and transition plans
The 2024 survey questioned entities for the first time about the emerging topics of nature risk and transition plans. While APRA has not set guidance or expectations regarding these topics, the survey has provided an initial view of entity engagement with these emerging risk topics. The survey results revealed that:
- Less than 20 percent of entities have a formal process for identifying material nature risks, while over 80 percent of boards do not oversee nature risk (Figure 30).
- Nearly 30 percent of entities have created a transition plan, and an additional 35 percent expect to do so in the next year (Figure 31).
- The prevalence of transition plans is highly variable by industry, with over half of superannuation trustees having created a plan compared to 35 percent of banks, and 15 percent of insurers.
Figure 30: Does your institution’s board or board committee oversee nature risk? (by count of industry respondents)

Figure 31: Has your institution prepared a climate transition plan? (by count of industry respondents)

5. Appendix B – Climate risk maturity metric: scoring method
The climate risk maturitymetric used throughout this Information Paper combines responses from 26 questions drawn from the survey’s governance and strategy, risk management, metrics and targets, and disclosure sections to provide an overall measure of how well an entity is addressing climate risk.
The subset of survey questions used in the scoring were chosen on two conditions:
- They were used for scoring in the 2022 iteration of the survey.
- They were not marked as ‘optional’ for Tier 3 and 4 entities.
The maturity metric is calculated based on the following process:
- A topic-specific maturity metric out of 100 is calculated for each of the four categories, with each question contributing equally to the score for its topic area:
- Governance and strategy: 7 questions
- Risk management: 13 questions
- Metrics and targets: 4 questions
- Disclosure: 3 questions
- The average score for each of the topic-specific maturity metrics (above) is weighted equally (25 percent each) to determine the overall climate risk maturity metric of an organisation (out of 100).
Survey responses from all respondents in 2024, and Tier 1 and 2 respondents from 2022, have all been scored according to this process to ensure that like-for-like comparisons can be made across entities in these varying cohorts.
Disclaimer and Copyright
While APRA endeavours to ensure the quality of this publication, it does not accept any responsibility for the accuracy, completeness or currency of the material included in this publication and will not be liable for any loss or damage arising out of any use of, or reliance on, this publication.
© Australian Prudential Regulation Authority (APRA) 2024
This work is licensed under the Creative Commons Attribution 4.0 Licence (CCBY 4.0). This licence allows you to copy, redistribute and adapt this work, provided you attribute the work and do not suggest that APRA endorses you or your work. To view a full copy of the terms of this licence, visit: https://creativecommons.org/licenses/by/4.0/
Footnotes
1Climate Risk Self-Assessment Survey (2022): www.apra.gov.au/information-paper-climate-risk-self-assessment-survey
2 As categorised under APRA’s Supervision Risk and Intensity (SRI) model: Tier 1 are individual entities that could have a large systemic impact, Tier 2 are individual entities that could have a systemic impact, Tier 3 are individual entities unlikely to have a systemic impact, Tier 4 are individual entities that would not have a systemic impact. Where an entity has provided a group level survey response, they were asked to select the highest Tier group for the entities covered, and their results are presented in line with this identification.
3 149 survey responses cover a greater number of entities due to the group-level responses submitted. Column widths of the Tier 1 and 2 chart, and the Tier 3 and 4 chart, are proportional to the total number of entities in scope.
4‘Large’ entities, for the purpose of this report, refers to Tier 1 and 2 entities. ‘Small’ entities refers to Tier 3 and 4 entities.
5 High performing’ entities are defined, for the purpose of this report as those entities with a maturity score of 50 or greater out of 100 ‘Poor performing’ entities are those with an overall climate risk maturity score of less than 50. This figure only includes Tier 1 and 2 entities that provided a survey response in both 2022 and 2024, as it uses paired survey responses.
6 See Appendix B for detail on the climate risk maturity metric.
7 ‘Scale of operations’ is used to represent relative industry coverage across the large and small respondents in the survey. For banks and superannuation trustees total assets are used to define scale of operations, while total revenue is used for insurance entities.
An entity’s scale of operations is as calculated as the entity’s total assets or revenue as a portion of the total assets or revenue of all survey responses within the industry group (banking, insurance, or superannuation). The right-hand side of the figure illustrates the cumulative operations covered by Tier 1 and 2 respondents, relative to Tier 3 and 4 respondents, within an industry group.
8Treasury Laws Amendment (Financial Market Infrastructure and Other Measures) Bill 2024
9 GI refers to general insurance (and includes reinsurance), LI refers to life insurance, and PHI refers to private health insurance. Some responses are duplicated in this chart, where they cover more than one of the insurance industries (e.g. show up in both life and private health insurance)
10Nature risk is defined by the Network for Greening the Financial System (NGFS) as the risk of negative effects on economies, individual financial entities and the financial system that result from: the degradation of nature, including its biodiversity, and the loss of ecosystem services that flow from it; or the misalignment of economic actors with actions aimed at protecting, restoring, and/or reducing negative impacts on nature.
11 Transition plans are defined by the NGFS as strategy documents that define an institution’s strategic plan to transforming its business model to adapt to a low-emissions climate-resilient economy.
12Respondents can define roles and responsibilities across multiple business lines, hence the industry responses do not add up to 100 percent.
13 This question was optional for responding Tier 3 and 4 entities.
14 Short term is defined as 1-5 years, medium term is defined as 5-10 years, and long term is 10 years and beyond. Respondents can select multiple horizons, so industry responses do not add to 100 percent.
15 ‘Pricing risk’ is considered a decrease in pricing certainty.
16 High emissions scenario assumes that only currently implemented policies are preserved leading to a 3°C or more of warming by 2100.
Disorderly transition scenario assumes additional climate policies are not implemented until 2030, and global warming is limited to below 2°C.
17Some responses are duplicated in this chart, where they cover more than one of the insurance industries (e.g. show up in both life and private health insurance)
18 Risk increase is defined as: decreasing market demand, increasing claims (physical and transition risk), increasing liability risk, decreasing market size, decreasing pricing certainty, increased policy exclusions, decreasing policy affordability, and decreased financial performance. This question focuses on direction of change, rather than expected magnitude.
19 Note: Where multiple entities have the same score, there are overlapping markers.
20 Targets must include the following: absolute or intensity-based targets; time frames; base year from which progress is measured; scope of emissions covered; and key performance indicators used to assess progress against targets)
21 Note: Where multiple entities have the same score, there are overlapping markers.