Annual superannuation bulletin - highlights
Industry overview
Total superannuation industry assets were $3.9 trillion as at 30 June 2024. Of this, $2.7 trillion (69.1 per cent) was held by APRA-regulated superannuation entities and $990 billion (25.2 per cent) was held by self-managed superannuation funds (SMSFs), which are regulated by the ATO. The remaining $224 billion comprised exempt public sector superannuation schemes ($167 billion, 4.3 per cent) and balance of life office statutory funds ($57 billion, 1.5 per cent).
Over the five years from June 2019 to June 2024:
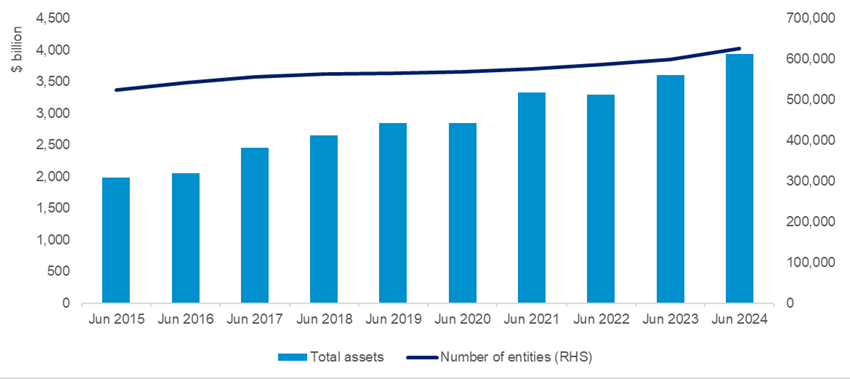
- total superannuation industry assets increased by 38.3 per cent from $2.8 trillion to $3.9 trillion (Chart 1);
- assets in APRA-regulated superannuation entities increased by 41.4 per cent from $1.9 trillion to $2.7 trillion; and
- SMSF assets increased by 38.6 per cent from $715 billion to $990 billion.
Over the same period, the number of APRA-regulated funds declined from 1,792 to 1,105 (38.3 per cent) with the number of APRA-regulated funds with more than six members declining from 171 to 93. In addition, there was a net reduction of 11 pooled superannuation trusts (PSTs) and 599 small APRA funds (six or less members) over the period. The number of SMSFs rose 11.0 per cent from 563,474 to 625,609 over the five years to June 2024.
Chart 1: Assets of superannuation entities
At 30 June 2024, there were 67 APRA-regulated RSE licensees responsible for managing 93 funds with more than six members. These funds had 22.5 million member accounts.
There were 459 directorships on the boards of APRA-regulated trustees at 30 June 2024, with females accounting for 43.6 per cent of directorships. The average board size was 7 directors, with average director remuneration of $88,895 per annum.
Entities with more than six members
The information provided below refers to APRA-regulated entities with more than six members and includes exempt public sector superannuation schemes.
Performance
The annual rate of return for the year ended June 2024 was 8.7 per cent, higher than the five year (5.6 per cent) and ten year (6.4 per cent) average annual return to June 2024. Stock markets around the world posted solid gains during the year ended June 2024 offsetting losses incurred by some funds in unlisted property.
Contributions and benefit payments
There was $184.2 billion of contributions and $117.5 billion of total benefit payments for the year ended June 2024. Lump sum benefit payments were 54.6 per cent of total benefit payments ($64.1 billion) and pension benefit payments were 45.4 per cent of total benefit payments ($53.3 billion) for the year ended 30 June 2024.
Net contribution flows for the year ended 30 June 2024 increased slightly by $0.9 billion to $62.0 billion (Chart 2). The increase in the Superannuation Guarantee rate to 11.0 per cent in July 2023, labour force growth and nominal wage growth boosted employer contributions by $14.6 billion in the year. Total benefit payments increased by $15.5 billion (or 15.1 per cent) over the year. Pension payments had stronger growth (23.0 per cent) than lump sum payments (9.3 per cent).
Chart 2: Net Contributions and Benefit Payments

Fees
A total of $10.2 billion in fees was paid in the year ended 30 June 2024, with 89.2 per cent of fees paid by members and the remaining balance largely paid by employer sponsors or from reserves. Administration fees ($4.4 billion) and investment fees ($3.6 billion) accounted for a large share of the fees paid.
Service provider expenses
Expenses paid to service providers totalled $9.1 billion for the year ended 30 June 2024, with 86.1 per cent ($7.9 billion) paid to external service providers and 13.9 per cent ($1.3 billion) paid to internal service providers.
Membership
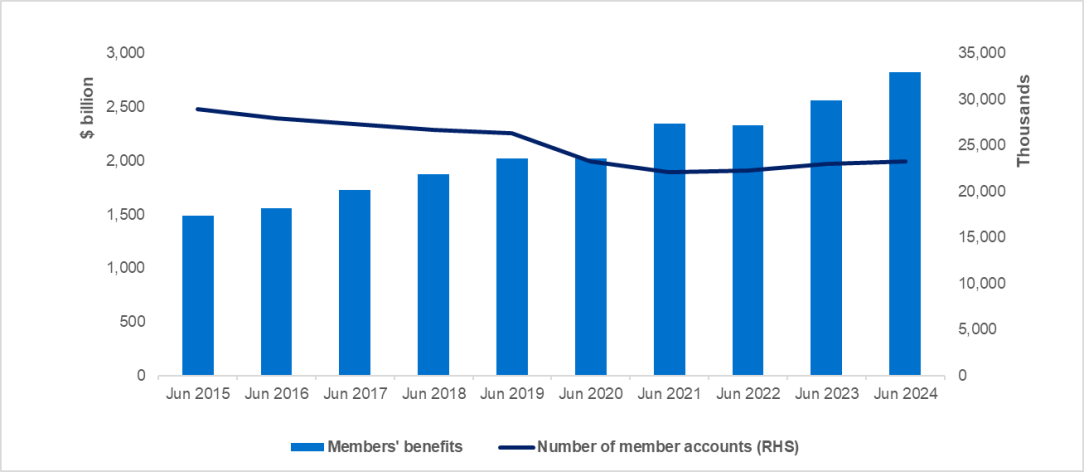
Members’ benefits increased by 9.9 per cent over the year to 30 June 2024, from $2,566 billion to $2,821 billion, which was driven largely by investment returns over the year. Over the five years from June 2019 to June 2024, members’ benefits increased by 39.8 per cent from $2,018 billion (Chart 3).
The number of member accounts at 30 June 2024 increased by 1.0 per cent to 23.3 million over the year. Over the five years from June 2019 to June 2024, the number of member accounts decreased by 11.7 per cent from 26.4 million. The decline in the number of member accounts was driven by member account consolidation including via transfers of inactive, low-balance accounts to the ATO under the Protecting Your Superannuation Package reforms. The average account balance at 30 June 2024 was $121,188.
Chart 3: Members’ benefits and number of accounts
MySuper products
Overview
There were 57 MySuper products offered by 45 RSEs at 30 June 2024.
There were 45 generic, 10 large employer and 2 material goodwill MySuper products. Of the total number of MySuper products, 25 have a lifecycle strategy.
Contributions and benefit payments
Total members’ benefits flows into MySuper products for the year ended 30 June 2024 were $117.7 billion, including $77.3 billion from employer contributions and $13.4 billion from member contributions.
Total members’ benefits flows out of MySuper products for the year ended 30 June 2024 were $72.1 billion, including benefit payments of $22.2 billion. Net member benefit inflows for the year ended 30 June 2024 were $45.6 billion.
Fees
Fees paid in relation to MySuper products totalled $3.3 billion for the year ended 30 June 2024, with 82.8 per cent of fees paid by members and the remaining portion largely paid from reserves. Administration fees ($1.8 billion) and investment fees ($1.4 billion) accounted for almost all of the fees paid.
Membership
Members’ benefits in MySuper products increased by 11.7 per cent over the year to 30 June 2024, from $955 billion to $1,067 billion. Members’ benefits in MySuper products were 38.0 per cent of total fund members’ benefits at 30 June 2024 (for entities with more than six members).
MySuper member accounts grew by 3.2 per cent over the year to 30 June 2024, from 14.9 million to 15.4 million. MySuper member accounts were 66.0 per cent of total fund member accounts at 30 June 2024 (among entities with more than six members). The average MySuper account balance at 30 June 2024 was $69,330.
Disclaimer and Copyright
While APRA endeavours to ensure the quality of this publication, it does not accept any responsibility for the accuracy, completeness or currency of the material included in this publication and will not be liable for any loss or damage arising out of any use of, or reliance on, this publication.
© Australian Prudential Regulation Authority (APRA) 2024
This work is licensed under the Creative Commons Attribution 4.0 Licence (CCBY 4.0). This licence allows you to copy, redistribute and adapt this work, provided you attribute the work and do not suggest that APRA endorses you or your work. To view a full copy of the terms of this licence, visit: https://creativecommons.org/licenses/by/4.0/