Annual superannuation bulletin - highlights
Industry overview
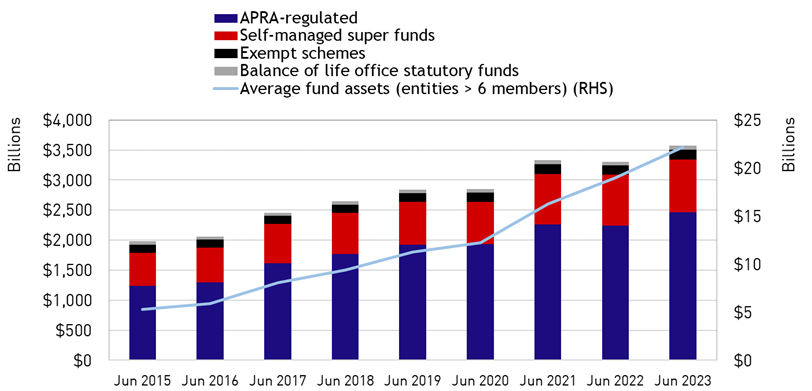
Total superannuation industry assets were $3.6 trillion as at 30 June 2023. Of this, $2.5 trillion (69.1 per cent) was held by APRA-regulated superannuation entities and $0.9 trillion (24.6 per cent) was held by self-managed superannuation funds (SMSFs), which are regulated by the ATO. The remaining $225.8 billion comprised exempt public sector superannuation schemes ($162.2 billion, 4.5 per cent) and balance of life office statutory funds ($63.6 billion, 1.8 per cent).
Over the five years from June 2018 to June 2023:
- total superannuation industry assets increased by 34.9 per cent from $2.6 trillion to $3.6 trillion;
- assets in APRA-regulated superannuation entities increased by 39.1 per cent from $1.8 trillion to $2.5 trillion; and
- SMSF assets increased by 29.3 per cent from $677.8 billion to $876.4 billion (Chart 1).
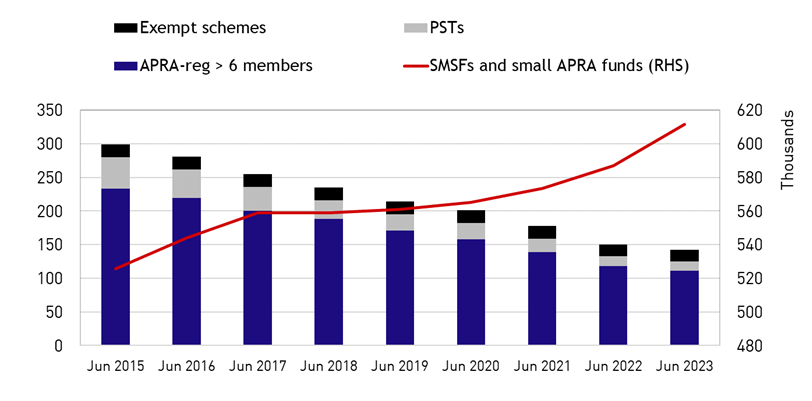
Over the same period, the number of APRA-regulated funds declined from 1,993 to 1,365 (31.5 per cent) with the number of APRA-regulated funds with more than six members declining from 188 to 111. In addition, 14 pooled superannuation trusts (PSTs) and 537 small APRA funds with less than five members (Chart 2) exited over the period. The number of SMSFs expanded by 9.6 per cent from 557,075 to 610,287 over the five years from June 2018 to June 2023.
Chart 1: Assets of superannuation entities

Chart 2: Number of superannuation entities

At 30 June 2023, there were 78 APRA-regulated RSE licensees responsible for managing 111 funds with more than six members. These funds had 22.3 million member accounts.
There were 510 directorships on the boards of APRA-regulated trustees at 30 June 2023, with females accounting for 42.5 per cent of directorships. The average board size was 7 directors, with average director remuneration of $81,843 per annum.
Entities with more than six members
The information provided below refer to APRA-regulated entities with more than six members and includes exempt public sector superannuation schemes.
Performance
The annual rate of return for the year ended June 2023 was 8.5 per cent, higher than the five year (5.3 per cent) and ten year (6.7 per cent) average annual return to June 2023. Global equity markets remained robust, even as global central banks continued to tighten monetary policy to reign in inflation. The Reserve Bank of Australia lifted the cash rate by 325 basis points during the financial year which increased the rate of return for cash and fixed income investments. Returns on Australian unlisted infrastructure were below their ten year annualised average return.
Contributions and benefit payments
There was $165.3 billion of contributions and $102.0 billion of total benefit payments for the year ended June 2023. Lump sum benefit payments were 57.5 per cent of total benefit payments ($58.7 billion) and pension benefit payments were 42.5 per cent of total benefit payments ($43.3 billion) for the year ended 30 June 2023.
Net contribution flows for the year ended 30 June 2023 declined by $2.6 billion to $61.1 billion. The increase in the Superannuation Guarantee rate to 10.5 per cent in July 2022, strong employment growth and the pick up in wage inflation boosted employer contributions by $14.6 billion in the year. Total benefit payments increased by $17.3 billion (or 20.4 per cent) over the year, which was attributable to a large jump in lump sum payments (32.4 per cent). Pension payments increased by 7.3 per cent.
Fees
A total of $9.7 billion in fees were paid in the year ended 30 June 2023, with 89.8 per cent of fees paid by members and the remaining balance largely paid by employer sponsors or from reserves. Administration fees ($3.8 billion) and investment fees ($3.9 billion) accounted for a large share of the fees paid.
Service provider expenses
Expenses paid to service providers totalled $8.3 billion for the year ended 30 June 2023, with 85.7 per cent ($7.1 billion) paid to external service providers and 14.3 per cent ($1.2 billion) paid to internal service providers.
Membership
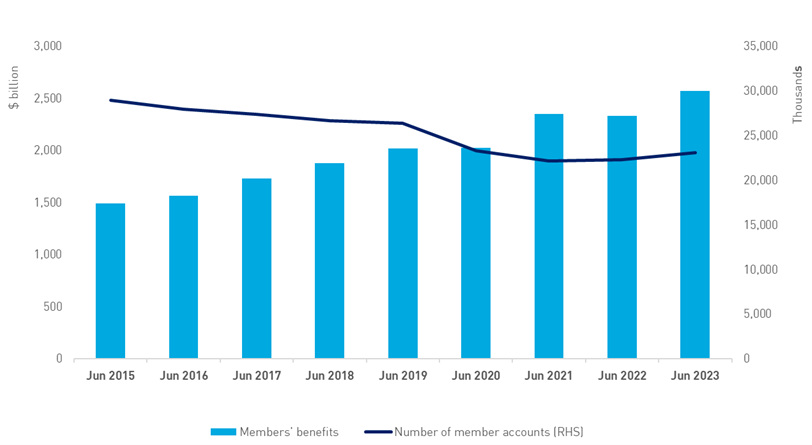
Members’ benefits increased by 10.0 per cent over the year to 30 June 2023, from $2,332.3 billion to $2,565.9 billion, which was driven by the higher-than-average investment return over the year. Over the five years from June 2018 to June 2023, members’ benefits increased by 36.9 per cent from $1,874.1 billion (Chart 3).
The number of member accounts at 30 June 2023 increased by 3.4 per cent to 23.0 million over the year. Over the five years from June 2018 to June 2023, the number of member accounts decreased by 13.6 per cent from 26.7 million. The decline in the number of member accounts was driven by the transfer of balances in inactive, low-balance accounts to the ATO under the Protecting Your Superannuation Package reforms. The average account balance at 30 June 2023 was $111,380.
Chart 3: Members’ benefits and number of accounts

MySuper products
Overview
There were 64 MySuper products offered by 50 RSEs with total assets of $995.3 billion at 30 June 2023 . This represented 40.4 per cent of assets held by APRA-regulated superannuation entities. Over the year to 30 June 20231, there was a 13.0 per cent increase in total assets in MySuper products.
There were 49 generic, 13 large employer and 2 material goodwill MySuper products with total assets of $911.7 billion, $17.5 billion and $66.3 billion respectively at 30 June 2023. Of the total number of MySuper products, 26 have a lifecycle strategy with $360.0 billion of total assets at 30 June 2023.
Contributions and benefit payments
Total members’ benefits flows into MySuper products for the year ended 30 June 2023 were $133.6 billion, including $68.8 billion from employer contributions and $10.7 billion from member contributions.
Total members’ benefits flows out of MySuper products for the year ended 30 June 2023 were $76.5 billion, including benefit payments of $17.7 billion. Net member benefit inflows for the year ended 30 June 2023 were $57.1 billion.
Fees
Fees paid in relation to MySuper products totalled $3.5 billion for the year ended 30 June 2023, with 85.7 per cent of fees paid by members and the remaining portion largely paid from reserves. Administration fees ($1.8 billion) and investment fees ($1.7 billion) accounted for almost all of the fees paid.
Membership
Members’ benefits in MySuper products increased by 12.6 per cent over the year to 30 June 2023, from $847.6 billion to $954.9 billion. Members’ benefits in MySuper products were 37.0 per cent of total fund members’ benefits at 30 June 2023 (for entities with more than six members).
MySuper member accounts grew by 4.9 per cent over the year to 30 June 2023, from 14.2 million to 14.9 million. MySuper member accounts were 65.0 per cent of total fund member accounts at 30 June 2023 (among entities with more than six members). The average MySuper account balance at 30 June 2023 was $63,976.
Footnote
1 There is a difference of $85 billion in investments which were classified as MySuper investments in the previous publication (Quarterly Superannuation Performance). The majority of the difference is due to members who have a partial interest in the option underlying the MySuper product, as well as an interest in other investment options available through a Choice product. These members and the associated member assets are included in totals for choice products, and are excluded from the MySuper product classification. The remaining amount is due to reclassification of investments as not being a MySuper interest, and differences in the definition of total investments.
For more information
Email dataanalytics@apra.gov.au or mail to
Manager, External Data Reporting
Australian Prudential Regulation Authority
GPO Box 9836, Sydney NSW 2001Looking for discontinued publications?
Search historical snapshots of APRA's website on the Australian Government web archive.